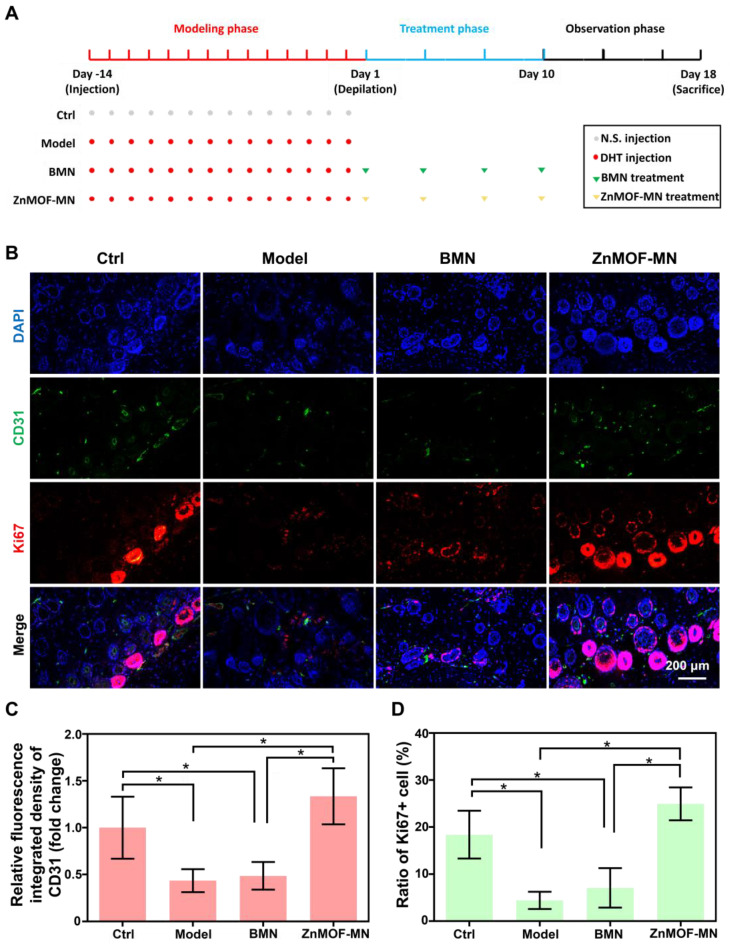
Figure 5.
Model establishment and histological study. A. Schematic illustration of the AA model established in C57BL/6 mice. B. representative fluorescence images of anti-CD31 and anti-Ki67 staining in different groups. C. Quantification of capillary density using anti-CD31 staining. D. Quantification of proliferating cell rate by anti-Ki67 staining. n = 3, *p < 0.05. Ctrl for the control group.

