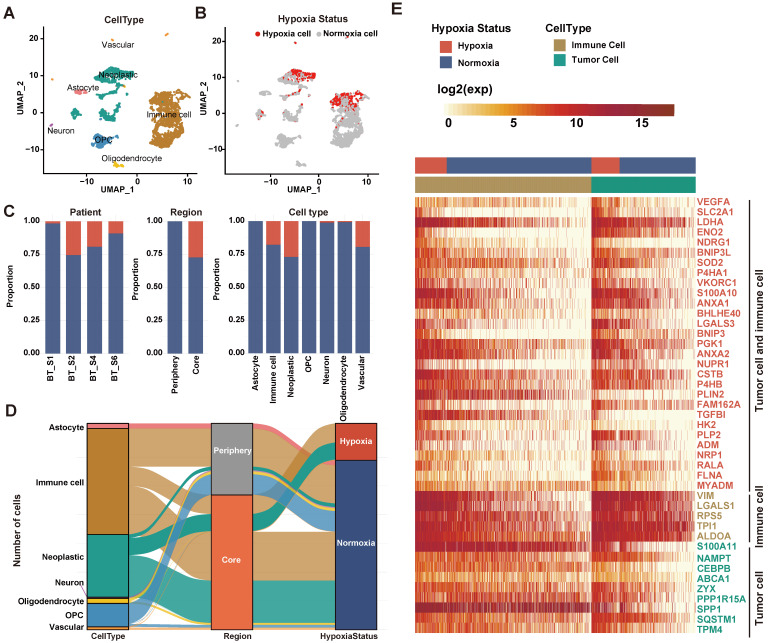
Figure 2.
Defining cellular hypoxia status in GBM. (A) UMAP plot of all the 3,589 single cells in 4 primary GBMs. Cell types were differentiated by colors. (B) UMAP plot of all single cells colored by hypoxia status. (C) Distribution of hypoxic cells in different patients, regions and cell types. (D) Sankey diagram showing the connection of cell types, cell- originating regions and hypoxia status. (E) Expression profile of hypoxia-related genes. The 29 red-colored genes were identified as important hypoxia-related genes in both tumor cells and immune cells, the five brown-colored genes were only identified as important hypoxia-related genes in immune cells, and the nine green-colored genes were only identified as important hypoxia-related genes in tumor cells.

