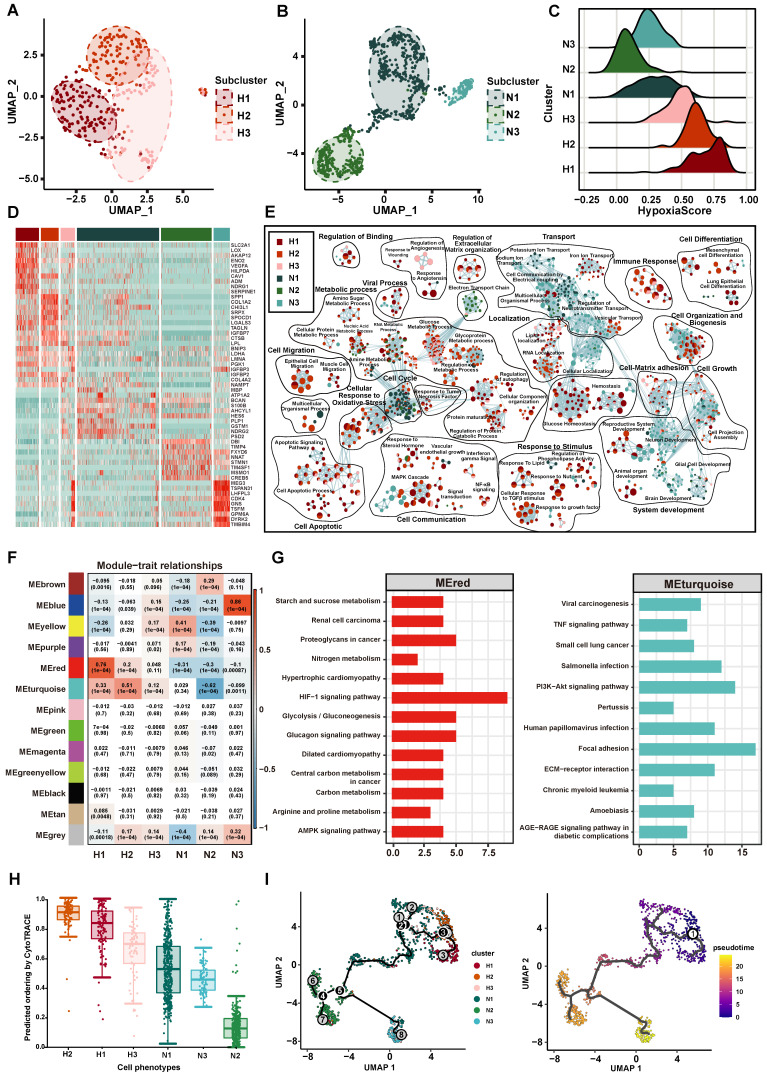
Figure 4.
The Characteristics of tumor cell subpopulation. (A-B) The UMAP plot showing hypoxic tumor cell subpopulations (A) and normoxic tumor cell subpopulations (B). Cell subpopulations are differentiated by colors. (C) Density distribution of hypoxia scores in six tumor cell subpopulations. (D) The heatmap plot of the top 10 differentially expressed genes in each subpopulation. (E) Enrichment map of biological pathways by marker genes in each subpopulation. Nodes in the network represent pathways and are colored by associated subpopulations. (F) The relationship between gene modules and subpopulations by WGCNA. (G) KEGG analysis of the MEred module (left) and MEturquoise module (right). (H) CytoTRACE score of each subpopulation. (I) Trajectory analysis of tumor cells, colored by each subpopulation (left) and pseudotime (right).

