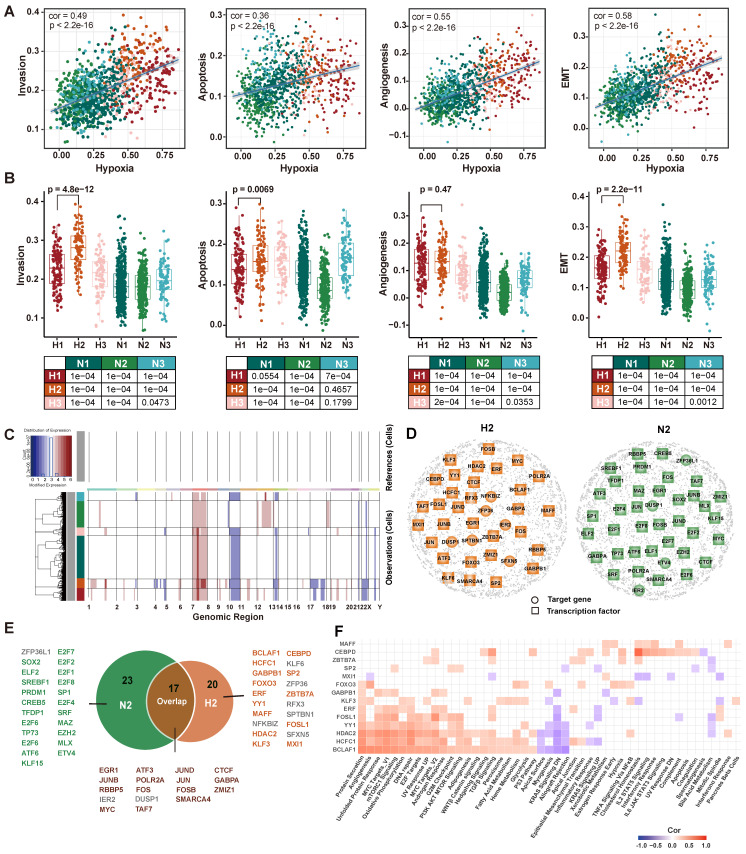
Figure 5.
Transcriptomic and genomic analysis of hypoxia and invasion. (A) Correlation analysis of hypoxia with invasion, apoptosis, angiogenesis, and EMT. (B) Boxplot showing the invasion, apoptotic, angiogenesis, and EMT enrichment scores for each subpopulation. (C) Heatmap of the inferred CNAs across six tumor subpopulation cells, in which genes are sorted by genomic location. (D) GRNs of H2 subpopulation (left) and N2 subpopulation (right). Colored nodes imply the critical target genes (circle) or TFs (square). (E) The critical TFs and critical target genes identified from two GRNs. Green represents TFs recognized only in the N2 GRN, orange represents TFs recognized only in the H2 GRN, and brown represents TFs recognized in both GRNs. Gray represents target genes recognized in GRNs. (F) Correlation analysis between hallmark pathway enrichment scores and regulatory module enrichment scores. The enrichment scores were calculated by GSVA. Empty space indicates that the |cor| < 0.3 or p >0.05.

