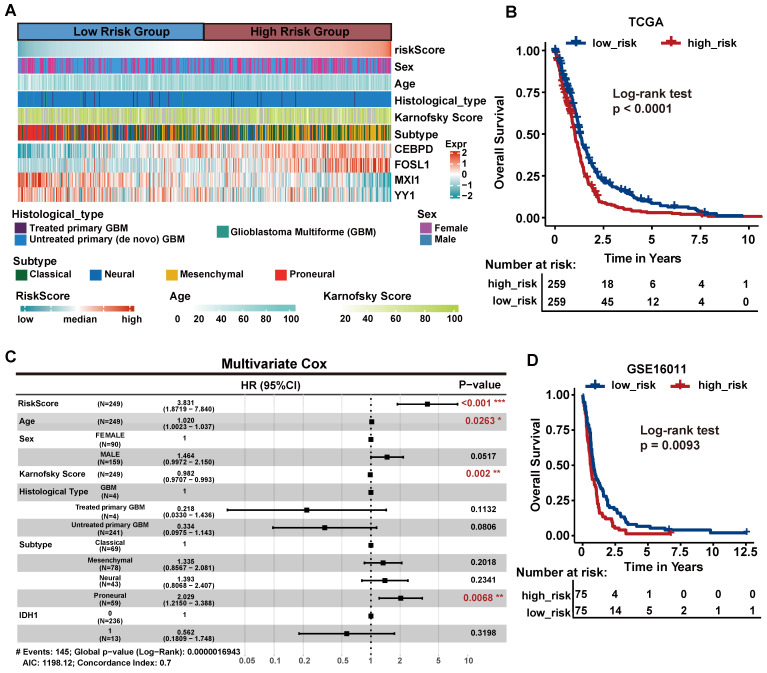
Figure 6.
The survival analysis of critical TFs. (A) Heatmap of the expression of the four critical TFs in 518 GBM patients from TCGA cohort with clinical and histopathological characteristics. Patients were sorted by risk score. (B) Survival analysis based on the prognostic model in the TCGA cohort. Patients in the high-risk group had poor survival. Log-rank p < 0.0001. (C) Multivariate Cox regression analysis validated risk score as an independent prognostic factor in TCGA. (D) Survival analysis in an external validation set GSE16011.

