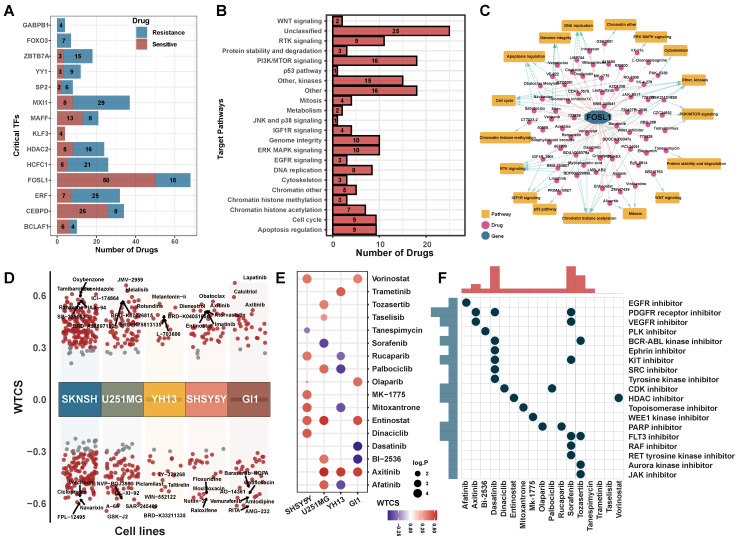
Figure 7.
Potential drugs targeting critical regulators. (A) The number of potential drugs targeting each critical TF. (B) Signaling pathways targeted by predicted potential drugs. (C) The network of FOSL1-related drugs and signaling pathways. The pink line indicated a positive correlation and the gray line indicated a negative correlation. Blue dotted line indicated the relationship between drug and regulated signaling pathways. (D) Candidate drugs perturbed by DEGs of critical TFs targeted in five brain cancer cell lines. WTCS > 0 represented that the drug was positive to the gene signature, WTCS < 0 represented that the drug was negative to the gene signature, and near zero represented unrelated. (E) WTCS of 17 potential drugs identified in both two strategies. The dot color indicated the value of WTCS and the dot size indicated the significance level (-log10 P-value). (F) CMap mode of action (MoA) analysis of the 17 compounds.

