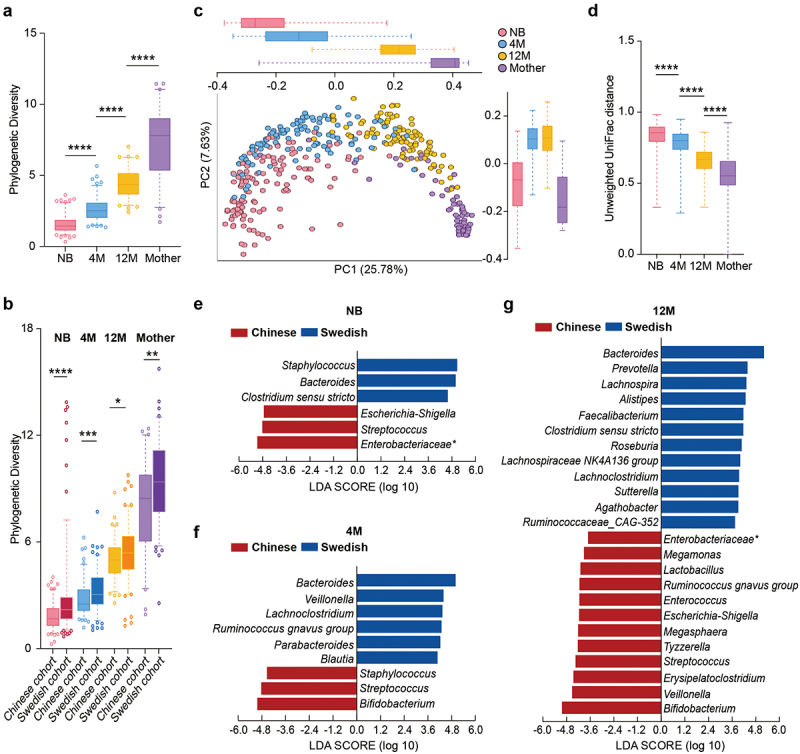
Figure 1.

Development of the gut microbiota with age in Chinese and Swedish cohorts. (a) Boxplot of gut microbial alpha diversity calculated by phylogenetic diversity metrics among the NB, 4 M, 12 M and mother groups. (b) Boxplot of gut microbial alpha diversity calculated by phylogenetic diversity metrics among the NB, 4 M, 12 M and mother groups in the Chinese cohort and Swedish cohort. (c) PCoA plot of the gut microbiota based on unweighted UniFrac distance among the NB, 4 M, 12 M and mother groups. The boxplots along each axis indicate the values of first and second principal coordinates, grouped by infant groups. The whisker plots indicate 95% confidence interval around medians. (d) Boxplot of unweighted UniFrac distance of gut microbiota among the NB, 4 M, 12 M and mother groups. (e-g) Discriminative bacteria of Chinese infants and Swedish infants in the NB (e), 4 M (f) and 12 M groups (g). (****p < 0.0001, ***p < 0.001, **p < 0.01, *p < 0.05).
