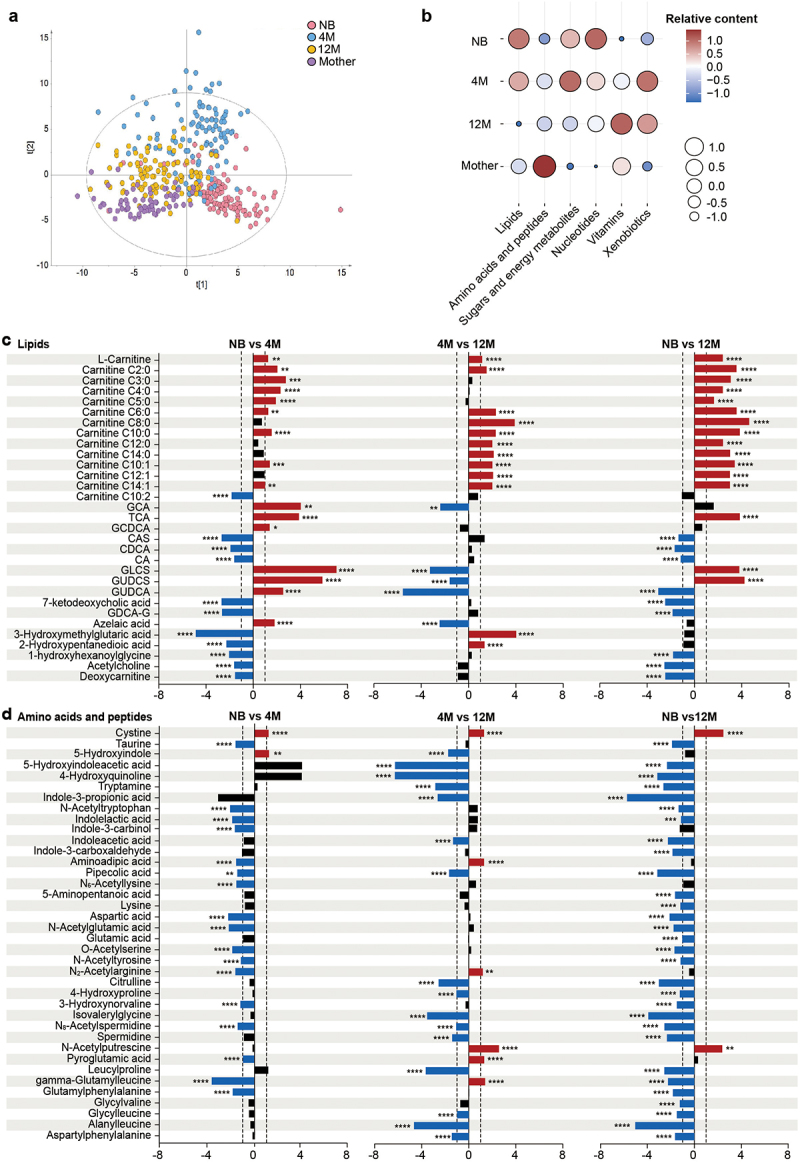
Figure 2.

Development of the fecal metabolome with age in a Chinese cohort. (a) PLS-DA plot of the fecal metabolome in the NB, 4 M, 12 M and mother groups (R2Y = 0.385, Q2 = 0.35). The permutation test (999 times) indicates that the model is not overfitted (R2 = 0.037 Q2 = −0.076). (b) Bubble plot of the total relative content of each metabolic subclass with age. (c-d) Fold changes in lipids (c), and amino acids and peptides (d) in the NB, 4 M and 12 M groups. Fold changes were calculated as the ratio of the relative content of each metabolite between the younger age group and the older age group and converted logarithmically. Red indicates Log2 FC > 1.0 and FDR < 0.05, blue indicates Log2 FC < −1.0 and FDR < 0.05, and black indicates no significant difference. (****p < 0.0001, *** p < 0.001, ** p < 0.01, * p < 0.05).
