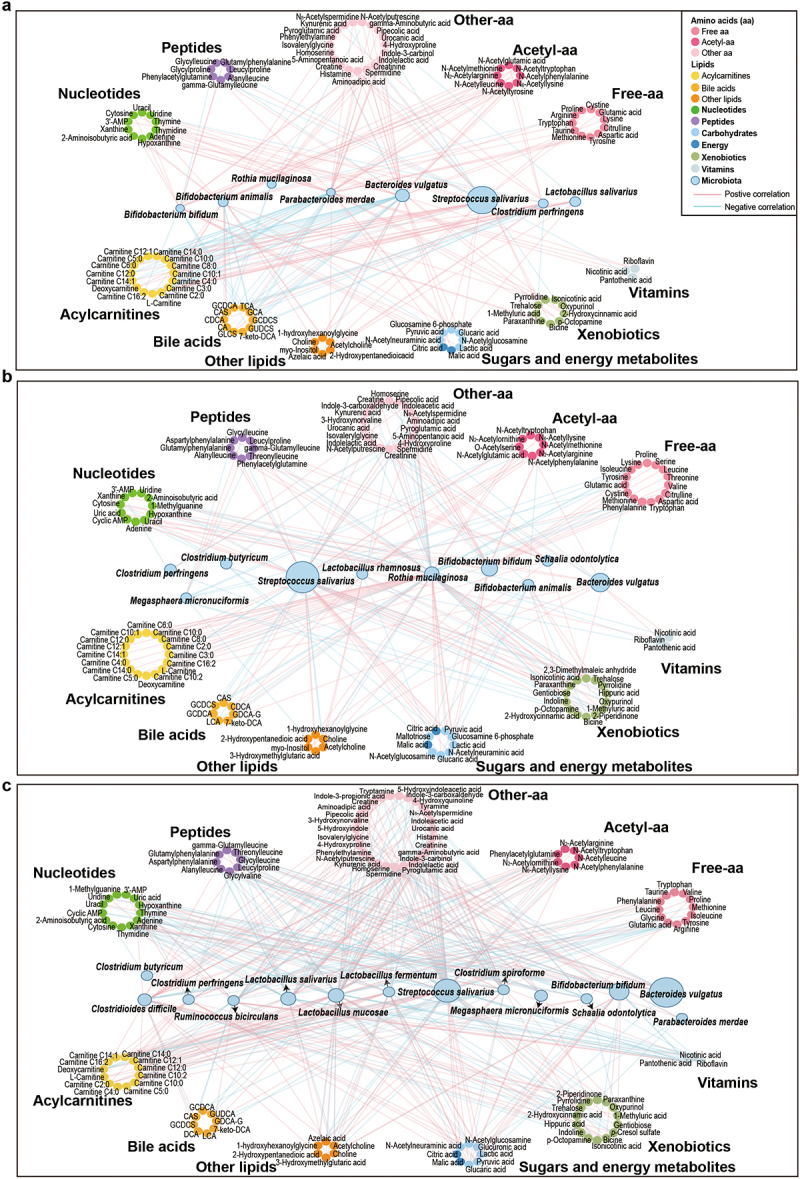
Figure 3.

Networks of interactions between the gut microbiota and fecal metabolites in the NB group, 4 M group and 12 M group at the species level. (a) NB group, (b) 4 M group and (c) 12 M group. The size of the microbial node indicates the relative abundance of the bacteria.
