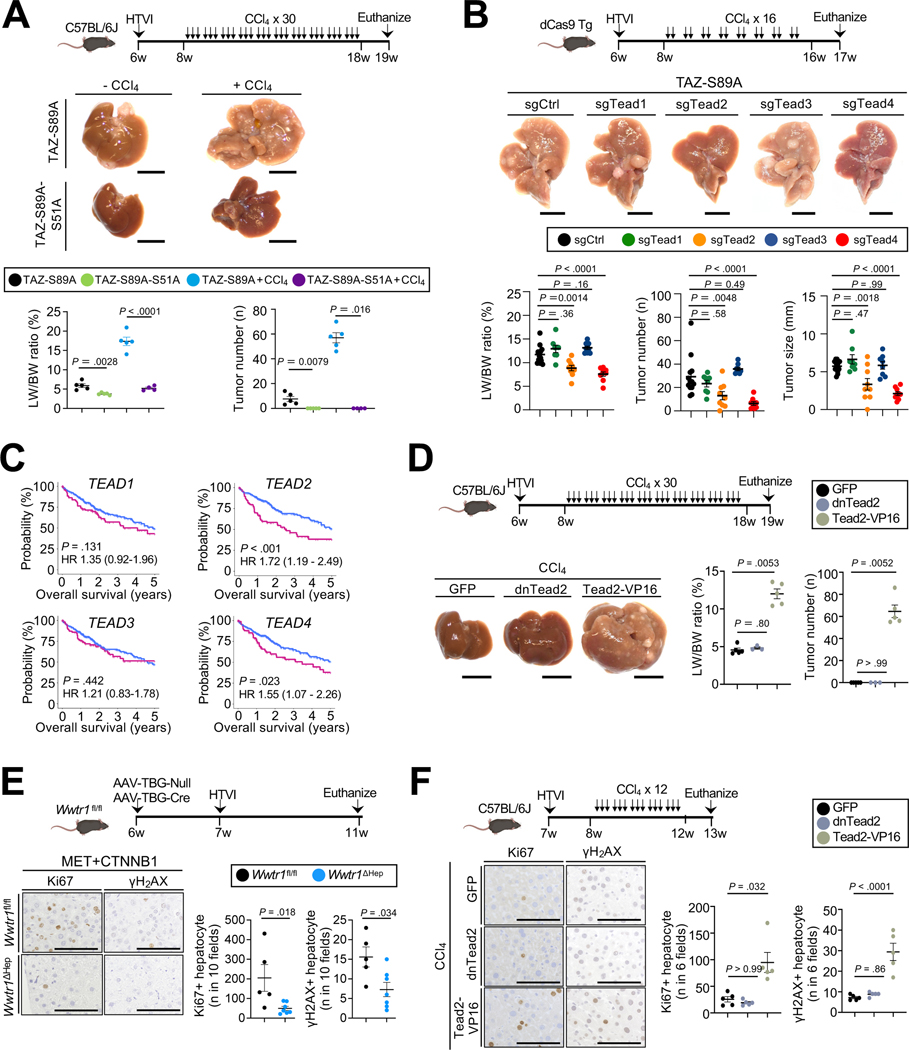
Figure 3. TAZ-TEAD2 interaction is crucial for HCC development by inducing proliferation.
A. Representative images, LW/BW ratio and tumor number (n=4–5 per group) from C57Bl/6 mice after HTVI of TAZ-S89A and TAZ-S89A-S51A (lacking interaction with TEADs) ± CCl4 (3 injections/week for 10 weeks). B. Representative images, LW/BW ratio, tumor number and size from dCas9 transgenic mice after HTVI of TAZ-S89A-sgCtrl/Tead1/Tead2/Tead3/Tead4 plasmids (n=13 sgCtrl, n=8 sgTead1, n=9 sgTead2, n=8 sgTead3 and n=9 sgTead4 mice) followed by CCl4 injections (2x/week for 8 weeks). C. Survival of HCC patients from the TCGA-LIHC cohort, stratified by expression of TEAD1, TEAD2, TEAD3 and TEAD4. D. Representative images, LW/BW ratio, tumor number and tumor size from C57BL/6J mice after HTVI of GFP (n=5 mice), dnTead2 (n=3 mice) and Tead2-VP16 (n=5 mice) plasmids, followed by CCl4 injection as depicted. E-F. Representative images and quantification of Ki67-and γH2AX-positive hepatocytes in Wwtr1fl/fl (n=5) or Wwtr1ΔHep (n=6) mice 4 weeks after HTVI of MET+CTNNB1S45Y plasmids (E) or C57BL/6J mice after HTVI of GFP, dnTead2 or Tead2-VP16 plasmids (n=5/group), followed by CCl4 as depicted (F). Scale bar (A,B,D): 1 cm, (E,F): 100 μm

