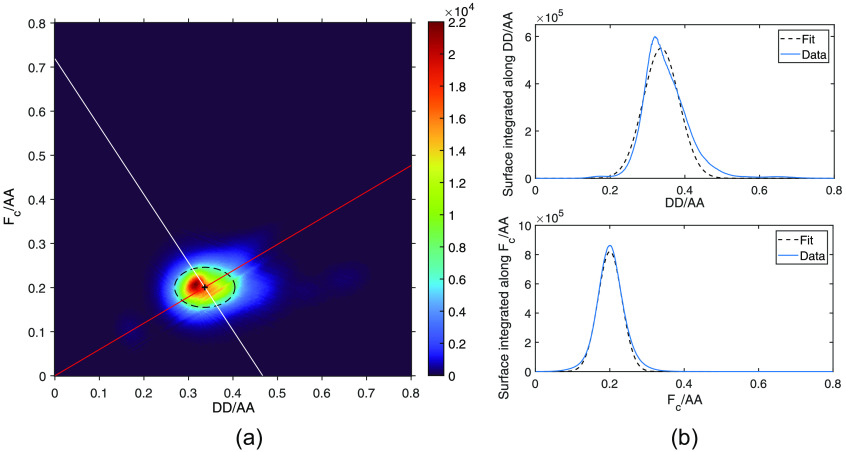
Fig. 4.
(a) Pixel-by-pixel heatmap of Fc/AA versus DD/AA of CHO-K1 cells expressing TSMod. 269 cells from 6 samples with exposure times of 100 or 200 ms and ND filter of OD 1 (around 48 millions pixels). The pixel values are fitted with a 2D Gaussian: . . The black cross represents the center of the fitted Gaussian, and the dashed ellipse is the 95% confidence bound of the Gaussian. The center of the Gaussian is given by and . The red and white lines represent Eqs. (2) and (3), respectively. (b) Projections of the 2D histogram along and axes.

