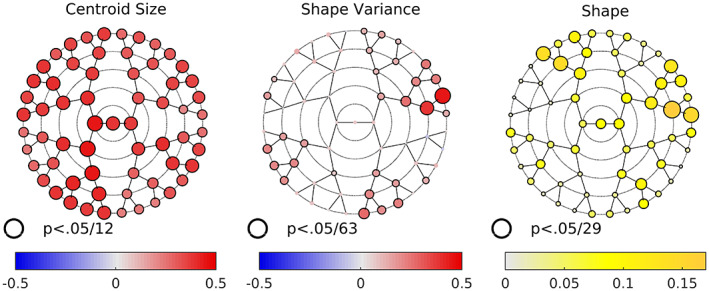
FIGURE 3.

Sex differences in centroid size, variance, and shape. For centroid size, the size and color of the nodes are indexed to A‐0.5, where A is the nonparametric estimate of the probability of superiority. 0.5 (red) indicates all men have larger centroid sizes than all women −0.5 indicates all women have centroid sizes larger than all men. For shape variance color and size are indexed to the log of the ratio of male variance to female variance. Shape, color, and size are indexed to the variance explained by sex in each module. For all three, black borders indicate a statistically significant difference after adjustment for multiple comparisons (see text).
