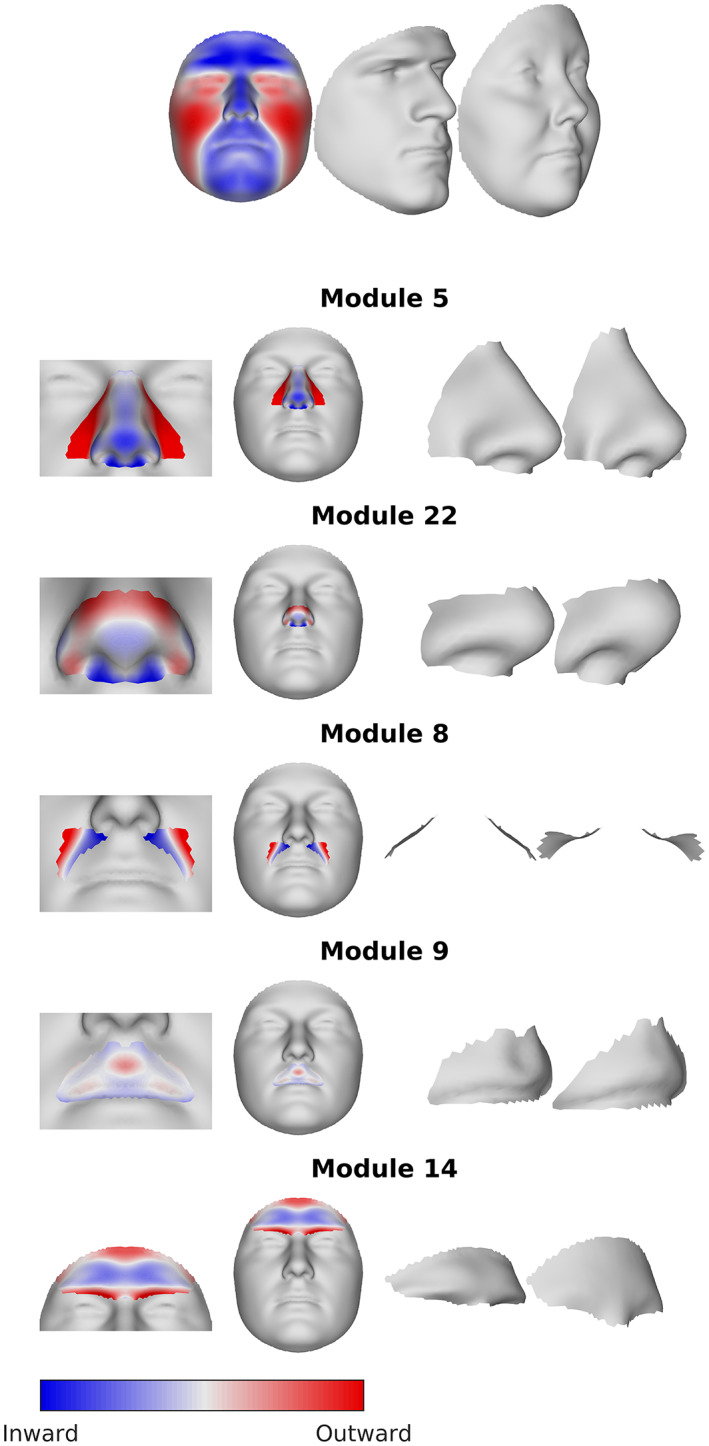
FIGURE 4.

Visualization of the sex differences in shape. Color maps show the regression coefficients associated with the effect of sex at each vertex, projected onto the surface normal. Red indicates the vertex is more locally outward in females than males, blue indicates the point is more locally inward. The static morphs illustrate the difference between the sexes, by showing an exaggerated hypermasculine and hyperfeminine face (see text).
