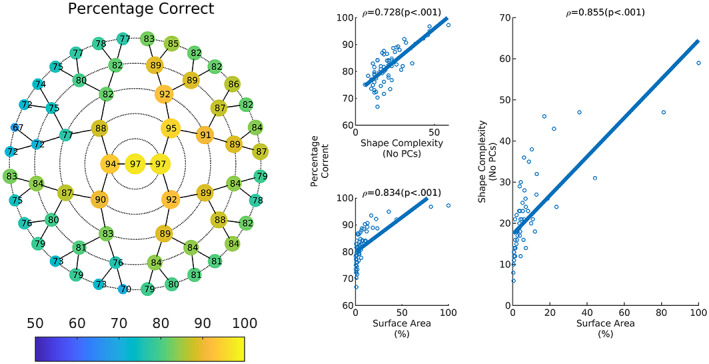
FIGURE 5.

Classification accuracy. The left shows the percentage of correct classification in each module. Right explores some predictors of classification accuracy. This shows proportion correct as a function of shape complexity and surface area of the module. The legend shows spearman's rho and the associated p values. Shape complexity as a function of the surface area is also plotted.
