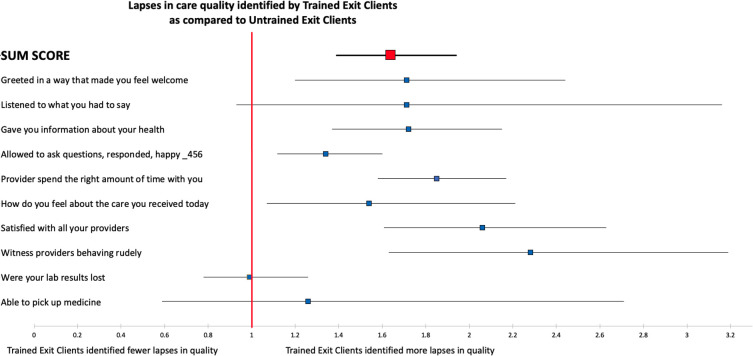
Figure 1.
Forest plot comparing responses from trained exit clients (TECs) relative to untrained exit clients (UECs) on 10 measures of clinic experience. Points indicate the rate ratio (for sum score) or prevalence ratio (for all others) for identifying a lapse in care in TEC surveys as compared with UEC. The sum score represents the total number of binary responses (yes vs no) across all clients in one group shown as a rate ratio. The red line indicates a rate or prevalence ratio of 1 and values greater than this indicate more lapses in care identified in TECs. Results are based on mixed-effects models adjusted for age, sex and education with a random effect at the facility.

