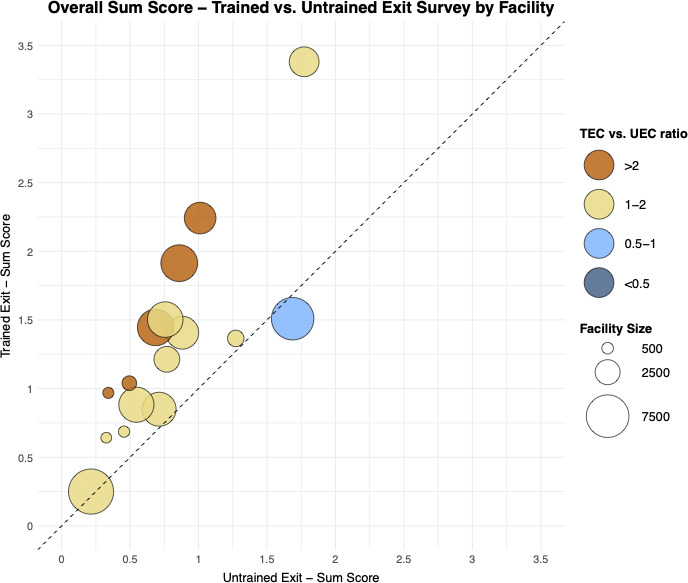
Figure 3.

Bubble plot showing trained exit sum score versus untrained exit sum score. Each bubble represents a single facility’s performance. Each bubble’s size indicates the number of patients at each facility with larger bubbles corresponding to larger facilities. The horizontal position notes the untrained exit sum score for all questions against the facility, and the vertical position notes the trained exit sum score at the same facility. TEC, trained exit client; UEC, untrained exit client.
