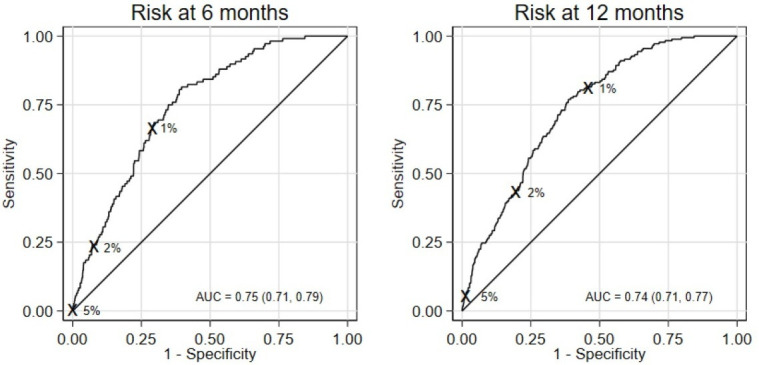
Figure 1.

ROC curve and AUC (95% CI) for the final model evaluated in the external validation sample at 6 and 12 months. Sensitivity and specificity for the risk thresholds considered (1%, 2%, 5%) are shown. AUC, area under the curve; ROC, receiver operating characteristic.
