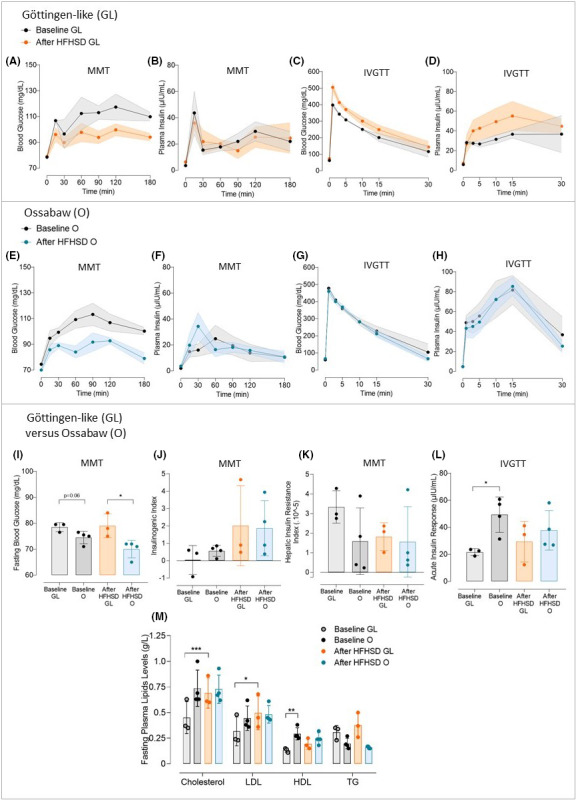
FIGURE 2.

Comparison of the Ossabaw and Göttingen‐like minipig strains' metabolic responses to a 2‐month High‐Fat, High‐Sucrose diet. (A–D) Mean curves (Mean ± SEM; n = 3) of Blood Glucose (A) and Plasma Insulin (B) during Mixed Meal Test (MMT) and Blood Glucose (C) and Plasma Insulin (D) during Intravenous Glucose Tolerance Test (IVGTT) in the Göttingen‐like (GL) strain, with the baseline characteristics represented in black and after 2‐month High‐Fat High‐Sucrose diet (HFHSD) in orange. (E–H) Mean curves (Mean ± SEM; n = 4) of Blood Glucose (E) and Plasma Insulin (F) during MMT and Blood Glucose (G) and Plasma Insulin (H) during IVGTT in the Ossabaw (O) strain, with the baseline characteristics represented in black and after HFHSD in blue. (I) Mean Fasting Blood Glucose (Mean ± SD) measured during MMT before (in black) and after (in colour) HFHSD in the Göttingen‐like (GL, in orange; n = 3) and in the Ossabaw (O, blue; n = 4) strains. (J, K) Mean Insulinogenic Index (J) and Hepatic Insulin Resistance Index (K) (Mean ± SD) calculated during MMT before (in black) and after (in colour) HFHSD in the Göttingen‐like (GL, in orange; n = 3) and in the Ossabaw (O, blue; n = 4) strains. (L) Mean Acute Insulin Response (Mean ± SD) calculated during IVGTT before (in black) and after (in colour) HFHSD in the Göttingen‐like (GL, in orange; n = 3) and in the Ossabaw (O, blue; n = 4) strains. (M) Fasting plasma lipid profile (Mean ± SD) assessed before (in black) and after (in colour) HFHSD in the Göttingen‐like (GL, in orange; n = 3) and in the Ossabaw (O, blue; n = 4) strains. HDL, high‐density lipoprotein; LDL, low‐density lipoprotein; TG, triglycerides; Total Chol, total cholesterol. Two‐Way ANOVA test for repeated measures and Sidak post‐hoc test; Paired or unpaired t‐test; *p < .05, **p < .01, ***p < .001.
