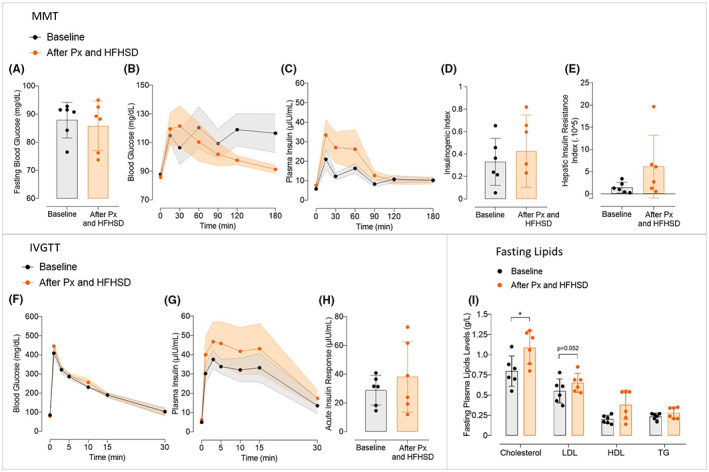
FIGURE 4.

Effect of the combination of a subtotal pancreatectomy followed by a 2‐month High‐Fat High‐Sucrose diet on glucose metabolism in Göttingen‐like minipigs. (A) Mean Fasting Blood Glucose (Mean ± SD; n = 6) measured during MMT before (in black) and after (in orange) subtotal pancreatectomy followed by a 2‐month High‐Fat High‐Sucrose diet (HFHSD). (B, C) Mean curves (Mean ± SEM; n = 6) of Blood Glucose (A) and Plasma Insulin (B) during MMT before (in black) and after (in orange) subtotal pancreatectomy followed by a 2‐month HFHSD. (D, E) Mean Insulinogenic Index (D) and Hepatic Insulin Resistance Index (E) (Mean ± SD; n = 6) calculated during MMT before (in black) and after (in orange) subtotal pancreatectomy followed by a 2‐month HFHSD. (F, G) Mean curves (Mean ± SEM; n = 6) of Blood Glucose (F) and Plasma Insulin (G) during IVGTT before (in black) and after (in orange) subtotal pancreatectomy followed by a 2‐month HFHSD. (H) Mean Acute Insulin Response (Mean ± SD; n = 6) calculated during IVGTT before (in black) and after (in orange) subtotal pancreatectomy followed by a 2‐month HFHSD. (I) Fasting plasma lipid profile (Mean ± SD; n = 6) assessed before (in black) and after (in orange) subtotal pancreatectomy followed by a 2‐month HFHSD. HDL, high‐density lipoprotein; LDL, low‐density lipoprotein; TG, triglycerides; Total Chol, total cholesterol. Two‐Way ANOVA test for repeated measures and Sidak post‐hoc test; Paired t‐test; *p < .05.
