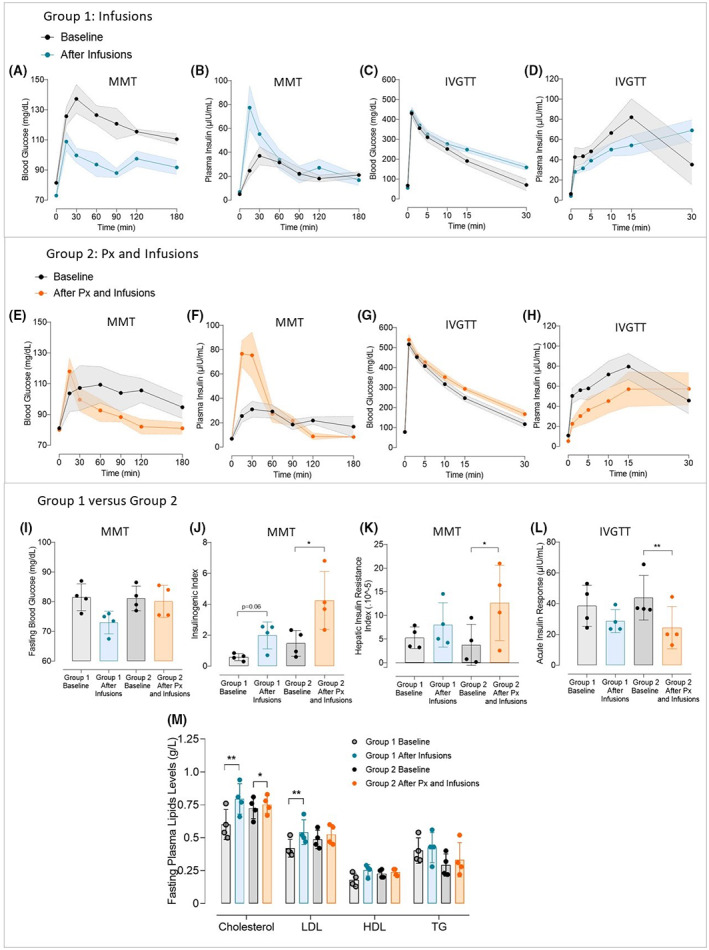
FIGURE 5.

Effect of long‐term intraportal glucose and lipid infusions on glucose metabolism in Göttingen‐like minipigs, whether or not they are preceded by a subtotal pancreatectomy. (A–D) Mean curves (Mean ± SEM; n = 4) of Blood Glucose (A) and Plasma Insulin (B) during Mixed Meal Test (MMT) and Blood Glucose (C) and Plasma Insulin (D) during Intravenous Glucose Tolerance Test (IVGTT) before (in black) and after (in blue) 3 weeks of long‐term intraportal glucose and lipids infusions. (E–H) Mean curves (Mean ± SEM; n = 4) of Blood Glucose (E) and Plasma Insulin (F) during Mixed Meal Test (MMT) and Blood Glucose (G) and Plasma Insulin (H) during Intravenous Glucose Tolerance Test (IVGTT) before (in black) and after (in orange) the combination of a subtotal pancreatectomy followed by 3 weeks of long‐term intraportal glucose and lipid infusions. (I) Mean Fasting Blood Glucose (Mean ± SD; n = 4 per group) measured during MMT at the baseline for Group 1 (in light grey) and Group 2 (in dark grey) and after 3 weeks of long‐term intraportal glucose and lipid infusions (Group 1, in blue) and after subtotal pancreatectomy followed by 3 weeks of long‐term intraportal glucose and lipid infusions (Group 2, in orange). (J, K) Mean Insulinogenic Index (J) and Hepatic Insulin Resistance Index (K) (Mean ± SD; n = 4 per group) calculated during MMT at the baseline for Group 1 (in light grey) and Group 2 (in dark grey) and after 3 weeks of long‐term intraportal glucose and lipid infusions (Group 1, in blue) and after subtotal pancreatectomy followed by 3 weeks of long‐term intraportal glucose and lipid infusions (Group 2, in orange). (L) Mean Acute Insulin Response (Mean ± SD; n = 4 per group) calculated during IVGTT at the baseline for Group 1 (in light grey) and Group 2 (in dark grey) and after 3 weeks of long‐term intraportal glucose and lipid infusions (Group 1, in blue) and after subtotal pancreatectomy followed by 3 weeks of long term intraportal glucose and lipid infusions (Group 2, in orange). (M) Fasting plasma lipid profile (Mean ± SD; n = 4 per group) assessed at the baseline for Group 1 (in light grey) and Group 2 (in dark grey) and after 3 weeks of long‐term intraportal glucose and lipid infusions (Group 1, in blue) and after subtotal pancreatectomy followed by 3 weeks of long‐term intraportal glucose and lipid infusions (Group 2, in orange). HDL, high‐density lipoprotein; LDL, low‐density lipoprotein; TG, triglycerides; Total Chol, total cholesterol. Two‐Way ANOVA test for repeated measures and Sidak post‐hoc test; Paired t‐test; *p < .05, **p < .01.
