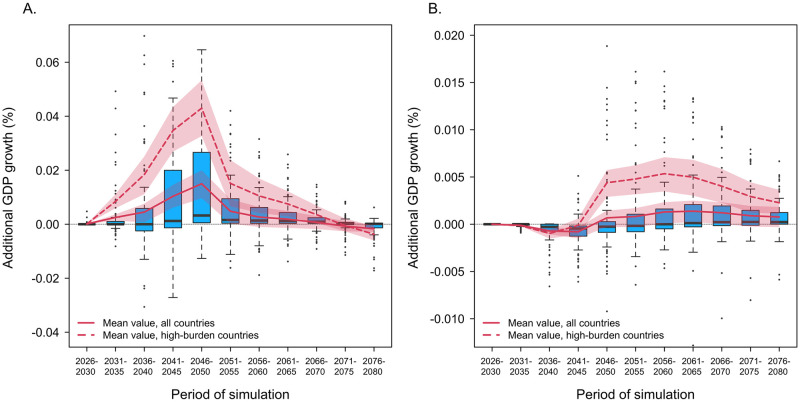
Fig 2. Incremental GDP growth compared to the no-new-vaccine counterfactual in successive 5-year periods from 2026 to 2080 for the adolescent/adult vaccine (panel A) and infant vaccine (panel B).
Note: Boxplots represent the distribution of results across individual countries (point estimates), for each 5-year period. Red lines indicate the arithmetic mean of these values for all countries (solid line) and the 30 countries identified as high-TB-burden by WHO (dashed line). Red shaded regions report 95% uncertainty intervals. Note different y-axis scales. GDP, gross domestic product; TB, tuberculosis; WHO, World Health Organization.

