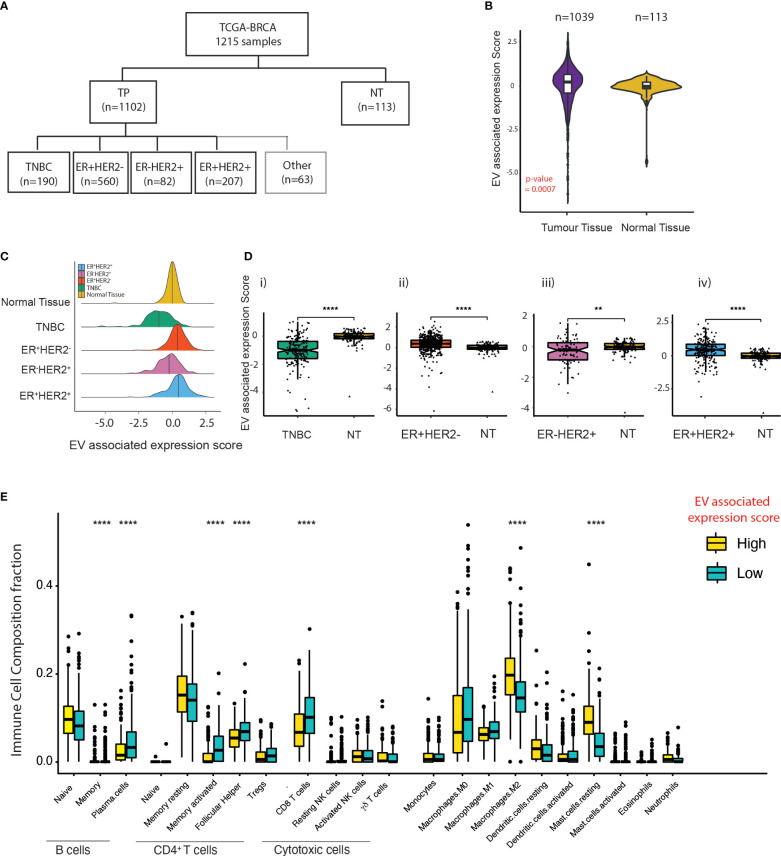
Figure 2.
EV expression in breast cancer subtypes within the TCGA dataset. (A) Classification of breast cancer tumours according to the expression of ER and HER2 from TCGA breast cancer dataset. (B) Violin plots of the EV-associated expression scores in tumour samples (n = 1,039) compared to adjacent normal mammary tissue (n = 113). The Kruskal–Wallis test was used for comparison. (C) Density plot of the distribution of EV-associated expression scores across TNBC, ER+HER2−, ER-HER2+, and ER+HER2+ breast cancer subtypes and “normal (adjacent breast) tissue” from TCGA database. (D) The EV expression score of tumour tissue compared to adjacent normal mammary tissue across differing breast cancer subtypes is shown. The median and quantiles are shown. The Kruskal–Wallis test was used for comparison (**** p < 0.0001; ** p < 0.01). (E) Immune cell infiltration scores for the EV-high and EV-low tumours determined by CIBERSORT. The median and quantiles are shown. Wilcoxon signed-rank test was used for comparison (**** p ≤ 0.0001).

