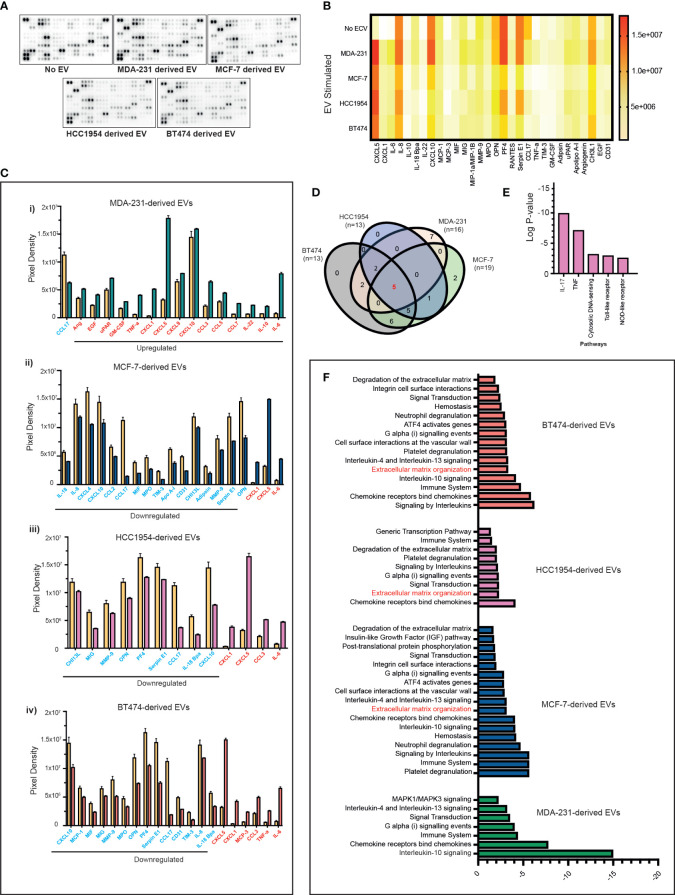
Figure 4.
Proteome profiles of secreted factors from nonstimulated and BC cell line EV-stimulated healthy volunteer PBMCs. (A) Representative human XL cytokine array dot blots are shown. (B) A heatmap of the analysis of dot blot intensity across all experimental conditions is shown. (C) Bar chart showing significant changes in analytes detected in PBMC culture supernatants stimulated with a cell line-derived EVs: (i) MDA-MB-231, (ii) MCF-7, (iii) HCC1954, and (iv) BT474-derived EVs compared to unstimulated PBMC. Upregulated analytes are illustrated in red and those downregulated are shown in blue. (D) The Venn diagram is used to identify overlapping and nonoverlapping up- or downregulated cytokines in the analysis of nonstimulated compared to MDA-231, MCF-7, HCC1954, and BT474 EV stimulated. (E) REACTOME pathway analysis of the commonly altered cytokines in EV-stimulated immune cells compared to nonstimulated immune cells. (F) Pathway analysis of specific analytes up- or downregulated in the supernatant of PBMC co-cultures with MDA-231, MCF-7, HCC1954, and BT474 EVs.

