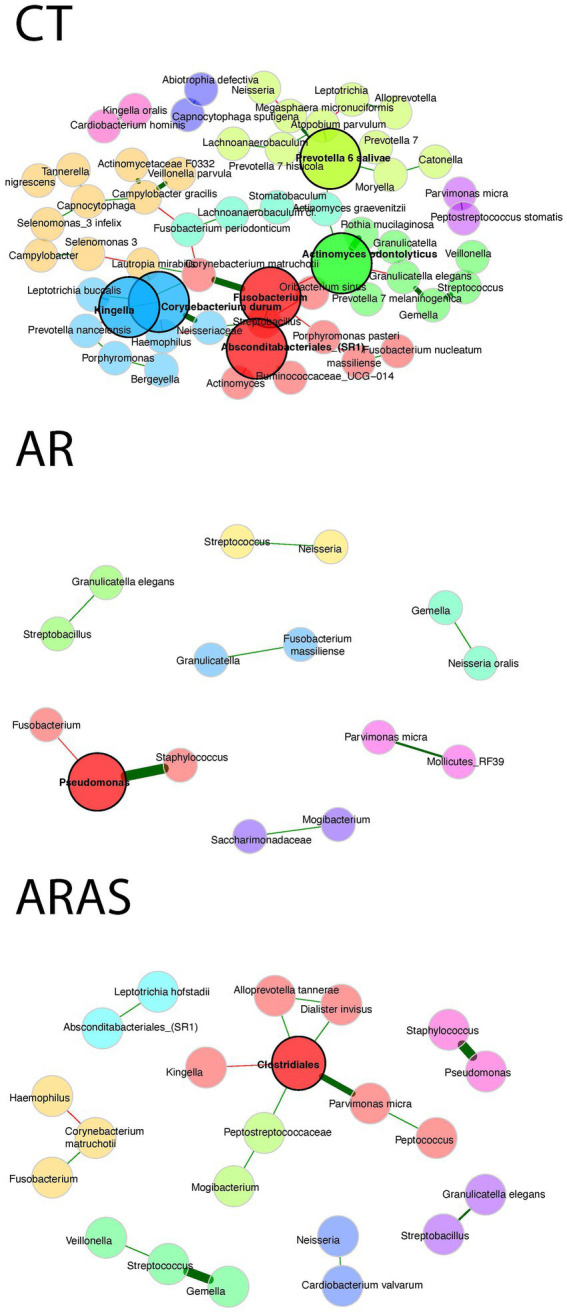
Figure 4.

Co-occurrence networks of bacterial taxa in the oral bacteriomes of participants with allergic rhinitis (AR), AR with comorbid asthma (ARAS) and healthy controls (CT). Nodes represent taxa connected by edges whose width is proportional to the strength of their association. Green and red edges indicate positive and negative correlations, respectively. Nodes within the 90th percentile of degree connectivity are considered hub nodes (black circle line). Inferred modules or subnetworks are colored differently.
