. 2023 Jul 11;12:e85316. doi: 10.7554/eLife.85316

Figure 1. SNORD90 expression is associated with antidepressant treatment response.

(A) Two-way mixed multivariable ANOVA indicates a significant interaction between clinical response (responders/non-responders; between-factor) and treatment course (T0/T8; within factor). Nine snoRNAs displayed significant effects in the discovery cohort. Five out of the nine snoRNAs were replicated in replication cohort 1 with SNORD90 and SCARNA3 further replicated in replication cohort 2. (B) Log2 fold-change of the expression of SNORD90 before and after antidepressant treatment for all three clinical cohorts. SNORD90 displayed significantly increased expression after eight weeks of antidepressant treatment specifically in those who responded across all three clinical cohorts. See Figure 1—figure supplement 1A for SCARNA3 expression (C) SNORD90 expression in human post-mortem ACC. Using toxicology screens, each sample was separated into the following groups: MDD with presence of antidepressants (MDD +AD; n=7), MDD with presence of non-antidepressant drugs (MDD +nonAD drugs; n=18), MDD with negative toxicology screen (MDD; n=8), controls with non-antidepressant drugs (control +nonAD drugs; n=15), and controls with negative toxicology screens (control; n=26). No control samples were positive for antidepressant drugs. (D) Snord90 expression in the ACC of mice that underwent unpredictable chronic mild stress (UCMS) and fluoxetine (flx) administration (UCMS + flx, n=5; UCMS, n=7; control +flx, n=6; control, n=5). (E) SNORD90 expression in human neuronal cultures exposed to various psychotropic drugs (n=4 per group). All bar plots represent the mean with individual data points as dots. Error bars represent S.E.M. One-way ANOVA with Bonferroni post-hoc (unless otherwise indicated on the graph). *p<0.05, **p<0.01, ***p<0.001.

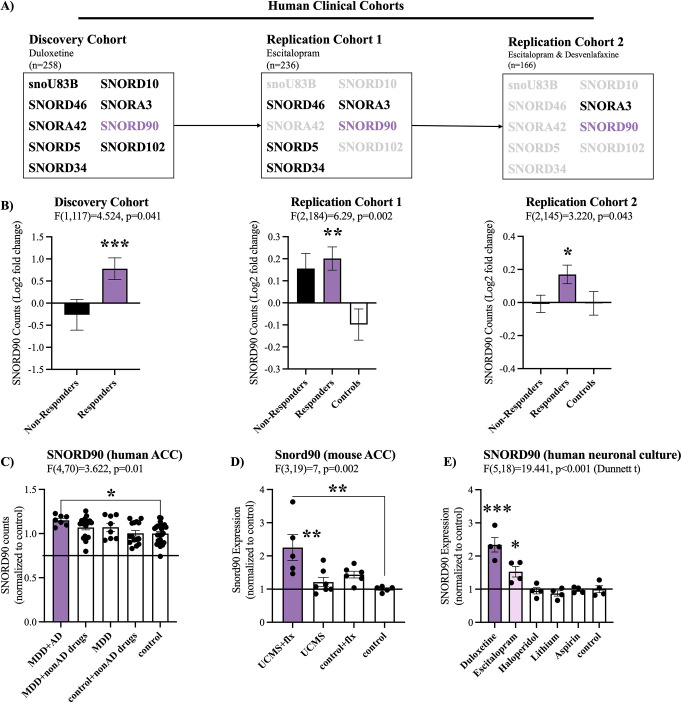
Figure 1.

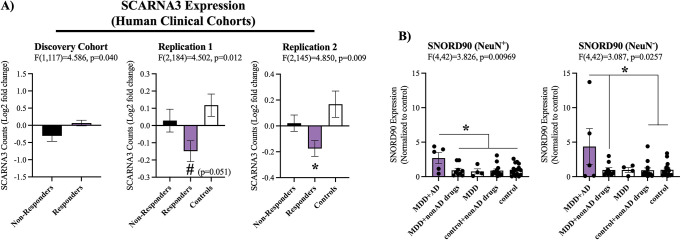
Figure 1—figure supplement 1. SCARNA3 expression in human clincial cohorts and SNORD90 expression in neuronal and non-neuronal cell types from human post-mortem ACC.

Figure 1—figure supplement 1.

(A) Log2 fold-change of the expression of SCARNA3 before and after antidepressant treatment for all three clinical cohorts. SCARNA3 displayed inconsistent expression across the three clinical cohorts after eight weeks of antidepressant treatment. (B) Fluorescence-activated nuclei sorting (FANS) sorted nuclei, collected from human port-mortem ACC samples, into NeuN+ (neuronal) or NeuN- (non-neuronal) cell types. SNORD90 expression in NeuN+ (left) and NeuN-(right). Using toxicology screens, each sample was separated into the following groups: MDD with presence of antidepressants (MDD +AD; n=5), MDD with presence of non-antidepressant drugs (MDD +nonAD drugs; n=9), MDD with negative toxicology screen (MDD; n=4), controls with non-antidepressant drugs (control +nonAD drugs; n=13), and controls with negative toxicology screens (control; n=16). No control samples were positive for antidepressant drugs. All bar plots represent the mean with individual data points as dots. Error bars represent S.E.M. Two-way mixed multivariable ANOVA (A), One-way ANOVA (B) with Bonferroni post-hoc. *p<0.05.
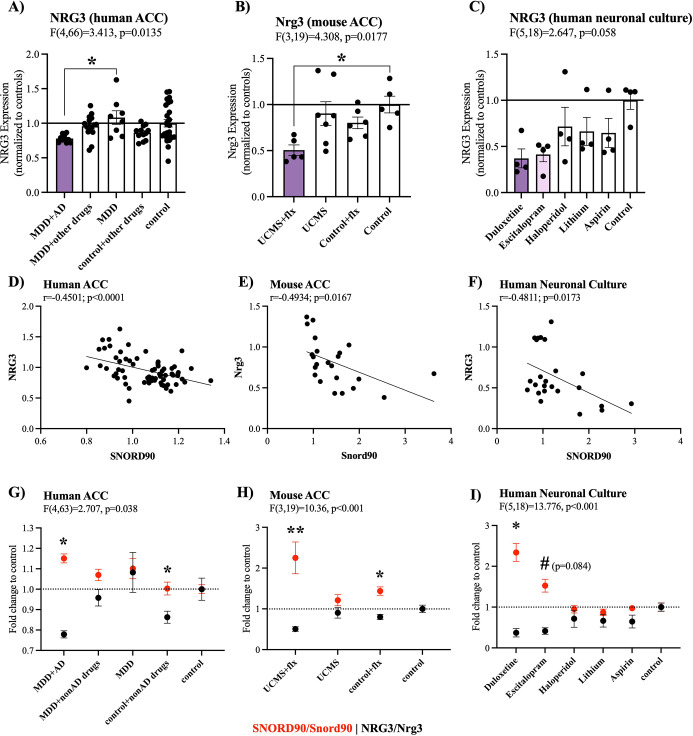
Figure 1—figure supplement 2. NRG3 expression is negatively associated with SNORD90 expression.

Figure 1—figure supplement 2.

(A) NRG3 expression in human post-mortem ACC. Using toxicology screens, each sample was separated into the following groups: MDD with presence of antidepressants (MDD +AD; n=10), MDD with presence of non-antidepressant drugs (MDD +nonAD drugs; n=16), MDD with negative toxicology screen (MDD; n=8), controls with non-antidepressant drugs (control +nonAD drugs; n=12), and controls with negative toxicology screens (control; n=25). No control samples were positive for antidepressant drugs. (B) Nrg3 expression in the ACC of mice that underwent unpredictable chronic mild stress (UCMS) and fluoxetine (flx) administration (UCMS +flx, n=5; UCMS, n=7; control +flx, n=6; control, n=5). (C) NRG3 expression in human neuronal cultures exposed to various psychotropic drugs (n=4 per group). (D–F) Correlation between SNORD90/Snord90 and NRG3/Nrg3 within each of the experiments detailed in (A–C). SNORD90/Snord90 and NRG3/Nrg3 displayed a significant negative correlation within each experiment. (G–I) SNORD90/Snord90 (red) and NRG3/Nrg3 (black) fold change in relation to control conditions plotted together within each experiment detailed in (A–C). SNORD90/Snord90 and NRG3/Nrg3 displayed the most opposing direction of expression in groups exposed to antidepressants in each of the experiments. All bar plots represent the mean with individual data points as dots. Error bars represent S.E.M. One-way ANOVA with Bonferroni post-hoc (A–C) Pearson correlation (D–F). Two-way mixed ANOVA with Bonferroni post-hoc (G–I). *p<0.05, **p<0.01.