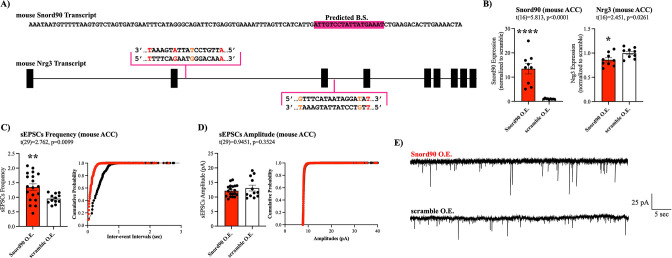
Figure 6. Snord90 induced down-regulation of Nrg3 increases glutamatergic neurotransmission.
(A) Full sequence of mature mouse Snord90 transcript with highlighted region predicted to bind to mouse Nrg3. Schematic representation of Nrg3 pre-mRNA transcript indicating regions on Nrg3 where Snord90 is predicted to bind (red nucleotide indicates mismatch, orange nucleotide indicates G-T wabble pair). (B) Viral injection of Snord90 expression vector (Snord90 O.E., n=9) or scramble control expression vector (scramble O.E., n=9) into Cg1/2 followed by qPCR confirmation Snord90 over-expression (left) and subsequent Nrg3 down-regulation (right). (C–E) Whole-cell patch-clamp recordings in Cg1/2 acute brain slices from mice. sEPSCs frequency (C) and sEPSCs amplitude (D) with cumulative probability plots (Snord90 O.E., n=19 neurons from 8 animals; scramble O.E., n=12 neurons from 3 animals) (E) Representative trace recording of sEPSCs in Cg1/2 pyramidal neurons. All bar plots represent the mean with individual data points as dots. Error bars represent S.E.M. Student’s two-tailed T-test. *p<0.05, **p<0.01, ****p<0.0001.


