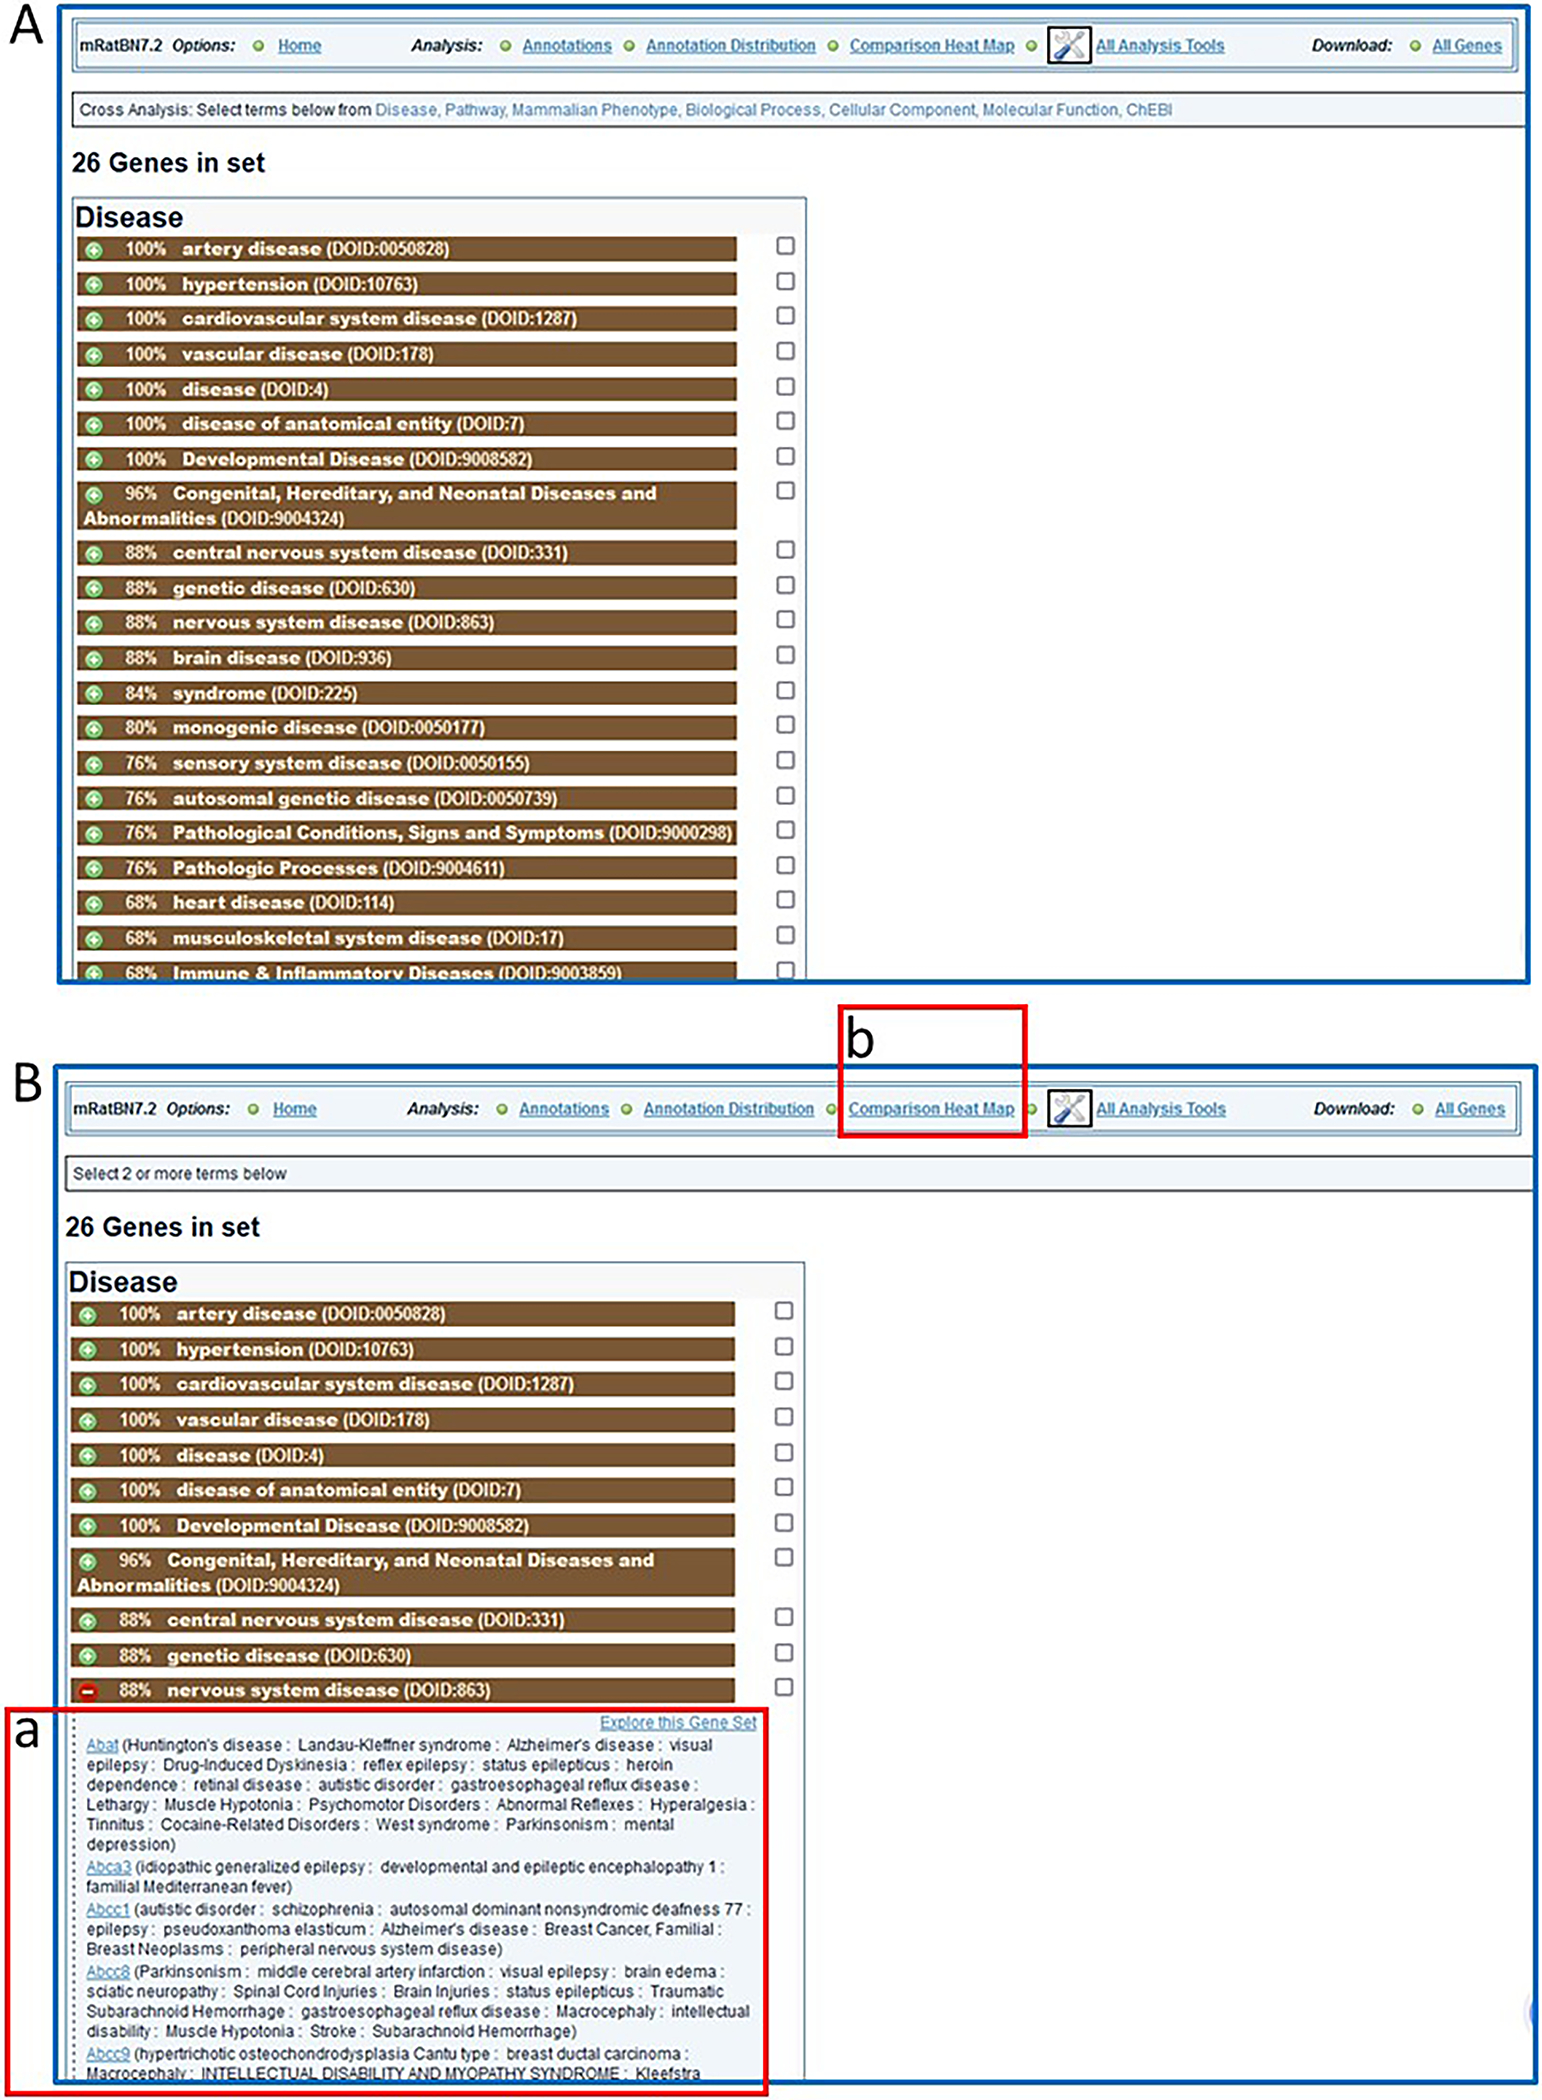
Figure 28.

A. Display of “Annotation Distribution” (enrichment-type analysis). B. Details for genes associated with one of the disease terms (nervous system disease, B-a) in the list and link (B-b) to “Comparison Heat Map” analysis.

A. Display of “Annotation Distribution” (enrichment-type analysis). B. Details for genes associated with one of the disease terms (nervous system disease, B-a) in the list and link (B-b) to “Comparison Heat Map” analysis.