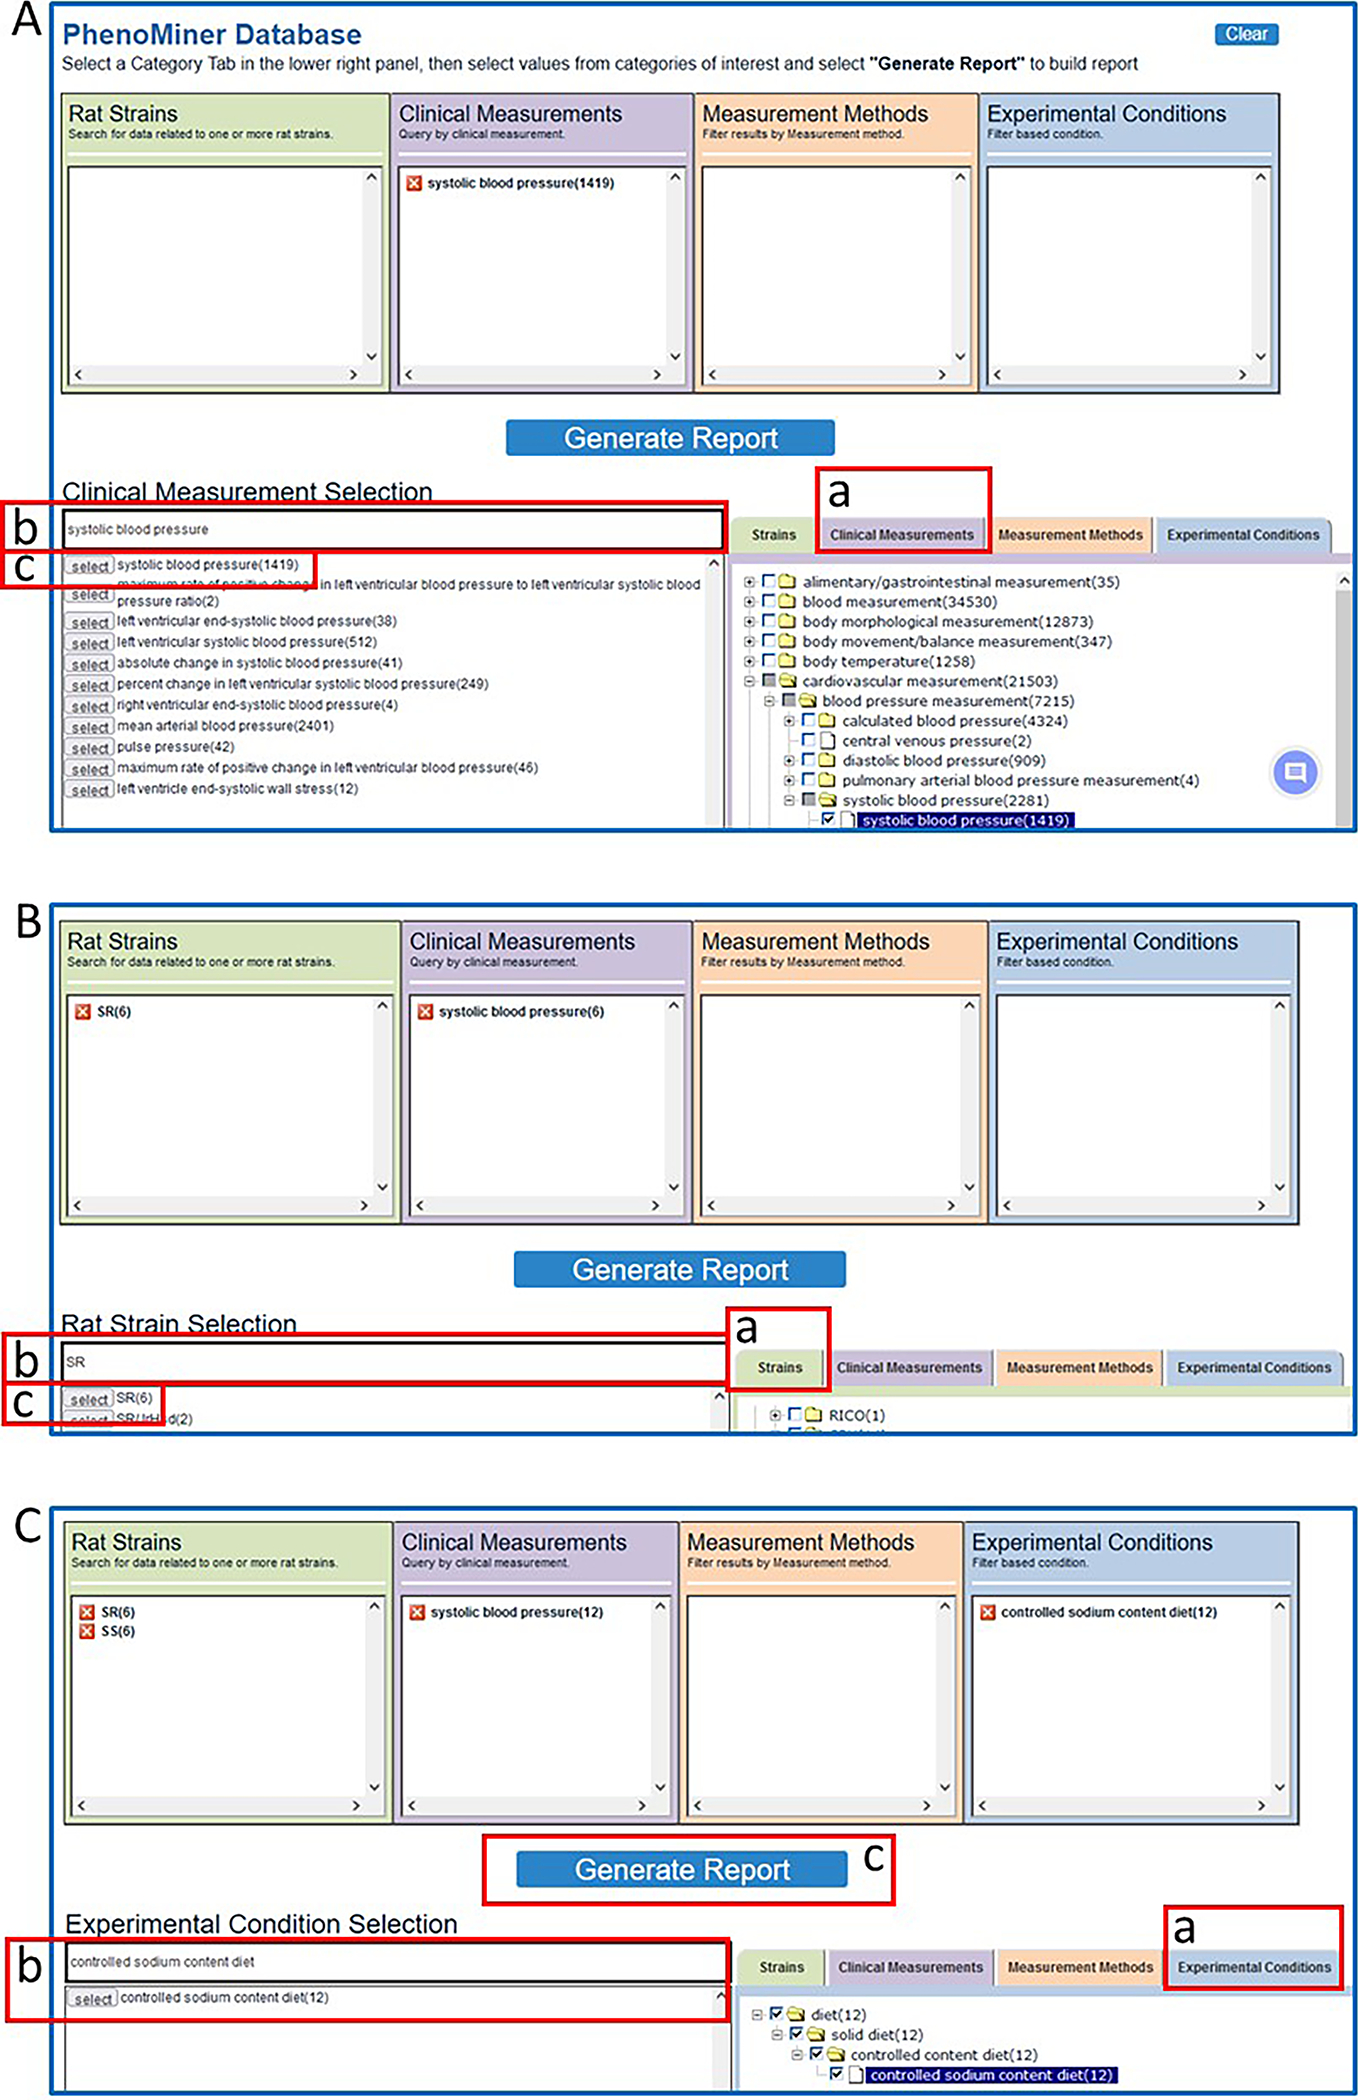
Figure 38.

Steps in querying the PhenoMiner database. A. After a selection of “Clinical Measurements” (A-a), “systolic blood pressure” is entered in a textbox (A-b) and selected (A-c). B. After a selection of “Strains” (B-a), “SR” is entered in a textbox (B-b) and selected (B-c). C. After repeating B-a, -b, -c for “SS”, “Experimental Conditions” (C-a) is selected, “controlled sodium content diet” is entered in a textbox and selected (C-b), and “Generate Report” is selected to activate the query.
