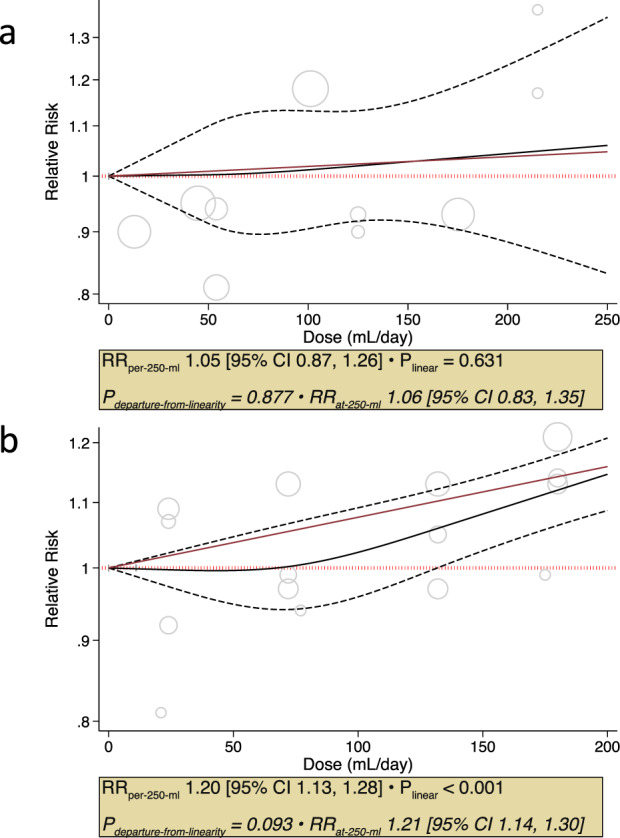
Fig. 2. Dose response meta-analysis of 100% fruit juice and non-specified fruit juice with incident type 2 diabetes.

Dose-response meta-analysis on the relation of (a) 100% fruit juice with incident type 2 diabetes in adults in 3 prospective cohort comparisons identified by EFSA (b) non-specified fruit juice with incident type 2 diabetes in 4 prospective cohort comparisons identified by EFSA. Individual comparisons are represented by the circles, with the weight of the comparison in the analysis represented by the size of the circle. The solid red line represents the linear dose response assessed by one stage linear mixed effects meta-analysis. The solid black line and outer black dashed lines represent the non-linear dose response and 95% confidence intervals, respectively, which were modelled with restricted cubic splines with 3 knots. Departure from linearity was assessed using the Wald’s test, with significance set at P < 0.05. CI confidence interval, RR relative risk.
