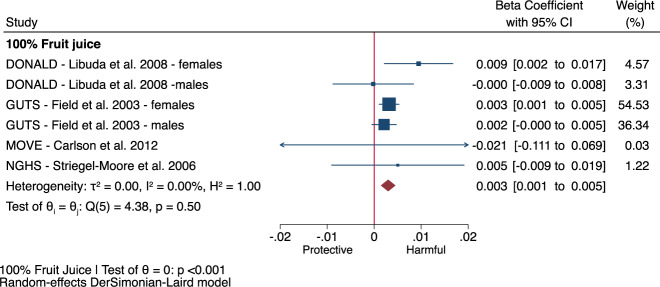
Fig. 4. Relation of 100% fruit juice with change in BMI z-score for every increase in serving (250 mL) per year in children in 6 prospective cohort comparisons identified by EFSA.
Effect estimates for each subgroup and overall effect are represented by the diamonds. Data are expressed as beta-coefficients with 95% confidence intervals using the generic inverse variance method with DerSimonian-Laird random-effects model. Inter-study heterogeneity was assessed using the Cochrane Q statistic and quantified using the I2 statistic, with significance set at P < 0.10 and I2 ≥ 50% considered to be evidence of substantial heterogeneity. Subgroup differences were tested using the standard Q-test with significance set at P < 0.10. BMI body mass index, CI confidence interval, DONALD Dortmund Nutritional and Longitudinal Designed Study, GUTS Growing Up Today Study, NGHS National Heart, Lung, and Blood Institute Growth and Health Study, RR relative risk.

