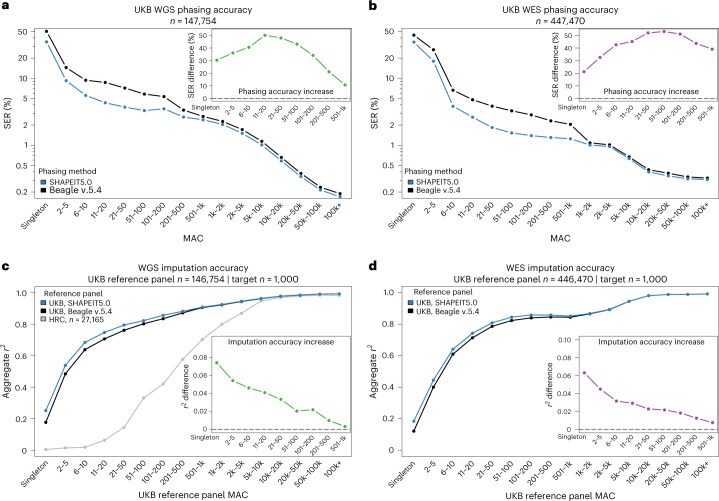
Fig. 2. Phasing performance.
a,b, SER (y axis, log scale) of SHAPEIT5 (blue) compared with Beagle v.5.4 (black) stratified by MAC (x axis) for the UKB WGS (a) and WES (b). The zoomed-in views show the relative reduction of SER using SHAPEIT5 compared with Beagle v.5.4 at rare variants. c,d, Imputation accuracy (Aggregate r2, y axis) for 1,000 white British samples genotyped with the Axiom array when using reference panels phased with either SHAPEIT5 (blue) or Beagle v.5.4 (black) WGS (c) or WES (d). In (c) the data were also imputed using the HRC reference panel (gray). The zoomed-in views show the increase of imputation accuracy at rare variants using the UKB dataset phased with SHAPEIT5 compared with Beagle v.5.4 as a reference panel.

