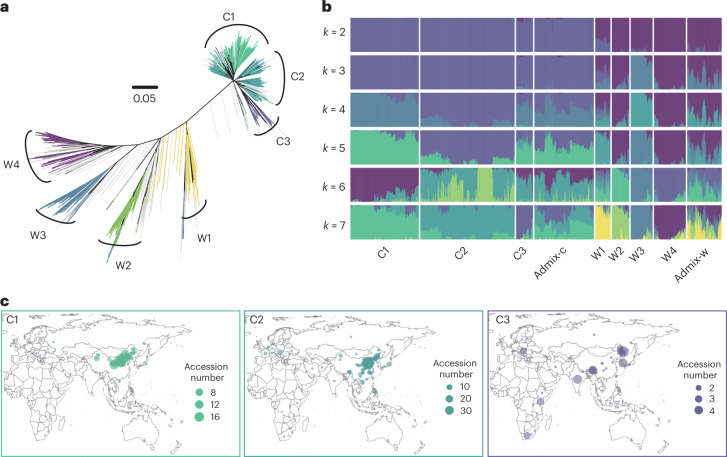
Fig. 1. Population structure of Setaria.
a, Phylogenetic tree of the 1,844 Setaria accessions. Gray lines indicate admixture, and other lines with different colors are subgroups corresponding to k = 7 in b. b, ADMIXTURE analysis from k = 2–7. c, Geographic distribution of three subgroups of foxtail millet accessions. C3 is distributed broadly compared to the other two subgroups. The map was created using the map data function in the R package ggplot2.

