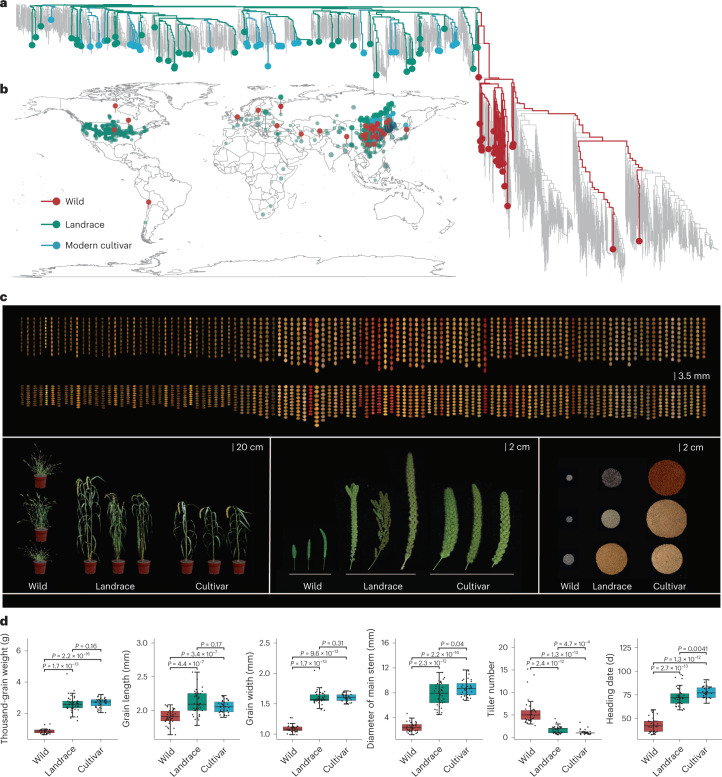
Fig. 2. The distribution and diverse phenotypes of 110 representative Setaria accessions.
a, Phylogenetic tree of the 1,844 Setaria accessions. Lines with different colors indicate the 110 accessions for de novo assembly as follows: wild (red), landrace (green) and cultivar (blue). b, Geographic distribution of the 110 diverse representative accessions among all 1,844 Setaria accessions. The color of points corresponds to a. The map was created using the map data function in ggplot2. c, GL and GW for 110 accessions, and characteristics of plant architecture, panicle shape/size and grain yield per panicle of representative wild, landrace and cultivar varieties of foxtail millet. d, Differences in TGW, GL, GW, diameter of main stem, tiller number and heading date for wild, landrace and modern cultivars. The number of samples in wild, landrace and cultivar in boxplots of d is 35, 40 and 35, respectively. In boxplots, the 25% and 75% quartiles are shown as lower and upper edges of boxes, respectively, and central lines denote the median. The whiskers extend to 1.5× the interquartile range. Significance levels are computed from two-sided Wilcoxon tests.

