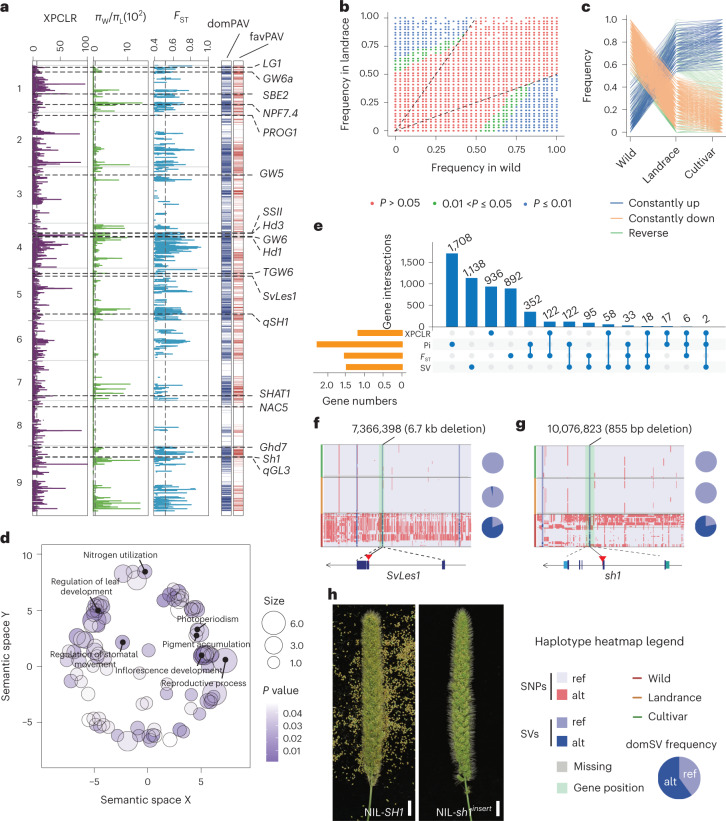
Fig. 4. GS signatures of foxtail millet domestication.
a, XPCLR, nucleotide diversity ratio (πW/πL), and FST tests are used for selection analysis in S. viridis. Vertical dashed lines indicate genome-wide threshold of selection signals (XPCLR > 9.66, πW/πL > 72.96 and FST > 0.53). DomPAV and favPAV correspond to b and c. b, Scatter plots show PAV frequencies in landrace and wild (P value computed using two-sided Fisher’s exact test). c, Frequency pattern of domestication-related PAVs (domPAVs). Lines in orange and blue indicate favPAVs during domestication. d, GO enrichment analysis of favPAV-genes. Color intensity (P value) reflects the significance of enrichment test (computed using two-sided Fisher’s exact test). Circle size represents the frequencies of aggregated GO terms. e, Intersection of domestication-related genes across PAV-based and three SNP-based methods. f, Haplotype and selective signature at SvLes1 gene. g, Haplotype and selective signature of sh1 gene. h, Shattering phenotype of NIL with SH1 and sh1insert allele. Scale bar, 1.5 cm. πW/πL, πwild/πlandrace.

