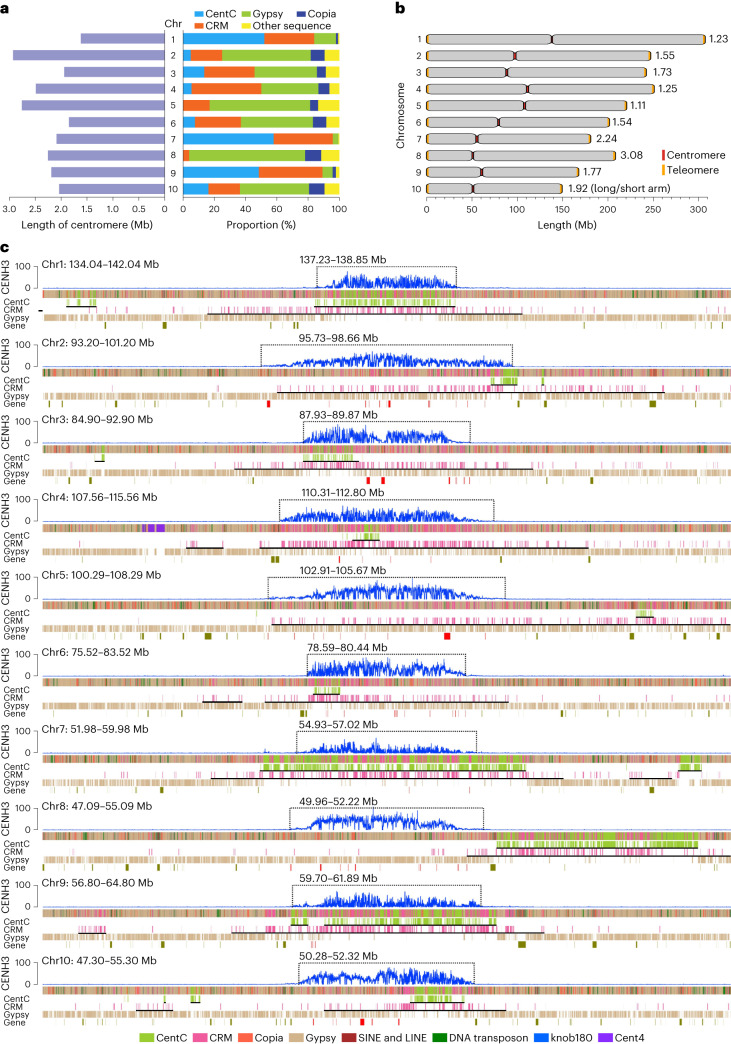
Fig. 5. Genome structure of the centromeric regions of ten chromosomes.
a, Comparison of the length and sequence composition of ten centromeres. b, Graphical representation of the centromeric positions on ten chromosomes. c, Schematic representation showing the distribution of different sequence compositions across ten centromeres. The CENH3 levels were represented by the enrichment level in 10 kb windows along chromosomes. The centromeres were marked by dotted boxes. The black solid lines under the tracks of CentC and CRM indicated the corresponding regions were identified as CentC arrays or CRM arrays. The red blocks for the track of gene indicated genes located in the centromeres.

