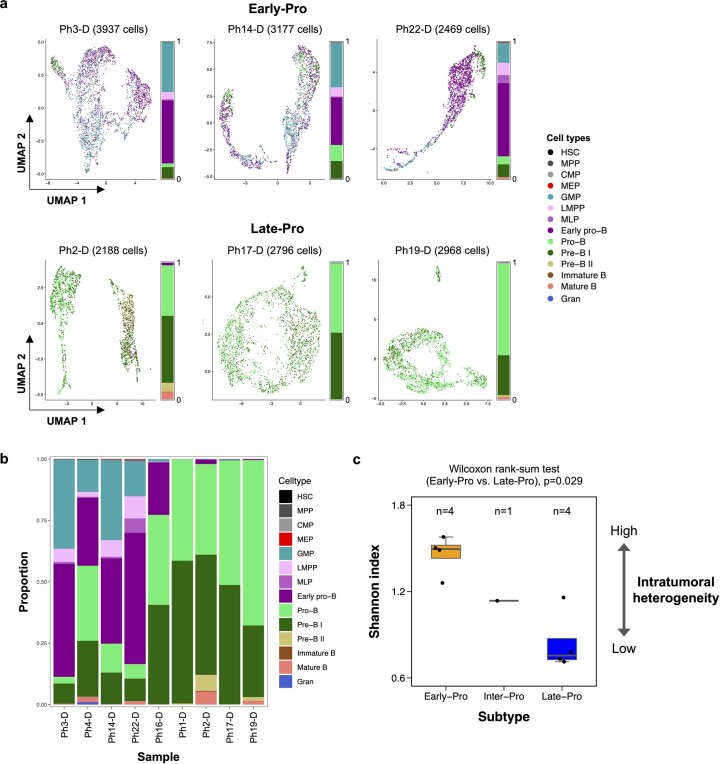
Extended Data Fig. 4. Cell type annotation of single-cell RNA-seq data.
a, Single cells from scRNA-seq are annotated with their closest normal cell counterparts and visualized using UMAP. Six cases (3 Early-Pro and 3 Late-Pro) not shown in Fig. 2f are shown here. Bars represent proportions of annotated cell types. b, Proportions of annotated cell types in nine scRNA-seq samples. c, Shannon diversity index of cell type annotations in each single-cell RNA-seq sample. p-value from Wilcoxon rank-sum test comparing Early-Pro and Late-Pro subtypes is shown.

