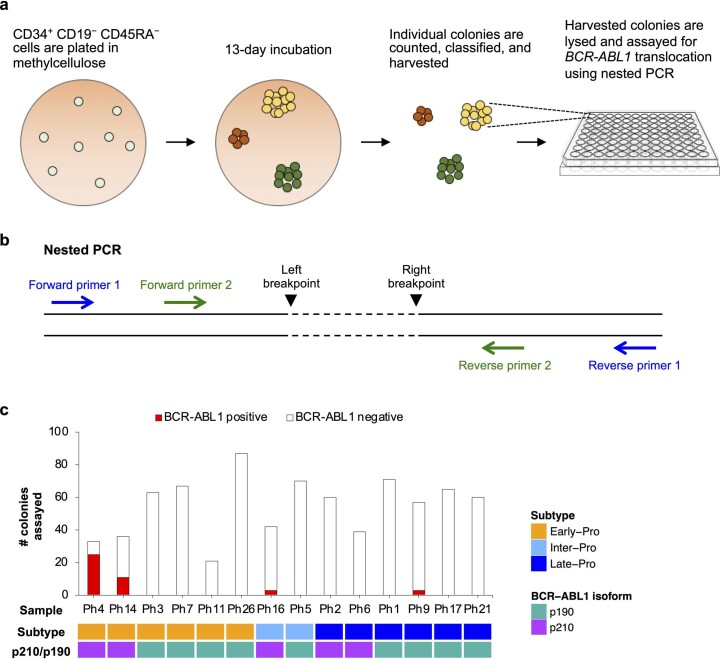
Extended Data Fig. 7. Colony formation assay.
a, Schematic representation of the colony formation assay. b, Schematic representation of the nested PCR. Two breakpoints of the assayed SV are located >5 kb apart on the same chromosome or on different chromosomes (for example BCR in chr22 and ABL1 in chr9). PCR amplification is successful only when the assayed SV is present. c, Numbers of BCR-ABL1 positive and negative colonies in 14 samples. Subtype and BCR-ABL1 isoform (p210/p190) of each sample are shown.

