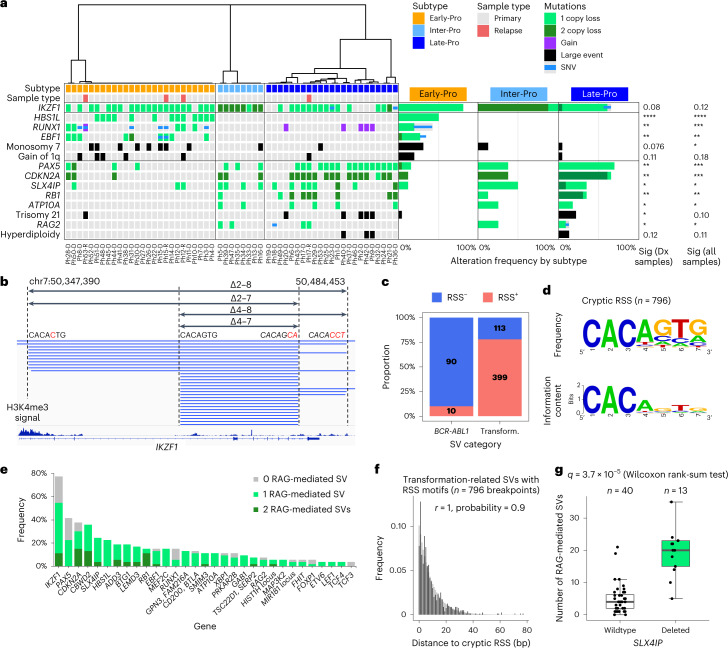
Fig. 3. Distinct cooperating genetic alterations define each molecular subtype.
a, Oncoprint of genetic alterations enriched in each subtype. Samples are in the same order as in Fig. 1a. Molecular subtype, sample type (diagnosis/relapse) and gene mutations are shown for each sample. Alteration frequencies in each subtype are shown on the right. IKZF1 deletions include monosomy 7. Copy number gains from trisomy 21 are not included in RUNX1 alteration frequencies. In hyperdiploid cases, trisomy 21 is a consequence of the hyperdiploid state. Fisher’s exact test was performed using only diagnostic samples or all samples. b, Recurrent IKZF1 deletions (blue lines) are generated by RAG-mediated recombination. RSS motifs near breakpoint clusters are shown. Right-side RSS are written in reverse complement and italicized. Bases that deviate from the canonical RSS (‘CACAGTG’) are in red. H3K4me3 ChIP–seq signal for GM12878 (B-lymphoblast cell line) from ENCODE is shown at the bottom. c, Proportions of BCR-ABL1-associated and transformation-related (Transform.) SVs with and without RSS motifs. d, Sequence logo of cryptic RSS heptamers from transformation-related SVs generated using WebLogo48. e, Frequencies of leukemias with alterations in each gene. Colors correspond to 0, 1 or 2 RAG-mediated SVs. f, Distances between SV breakpoints and nearest RSS motifs (black) in transformation-related SVs form a negative binomial distribution (gray). g, Numbers of RAG-mediated recombinations in primary leukemias by deletion status of SLX4IP. Sig, statistical significance; Dx, diagnosis. ****P < 5 × 10⁻⁵ < ***P < 5 × 10⁻⁴ < **P < 0.005 < *P < 0.05.

