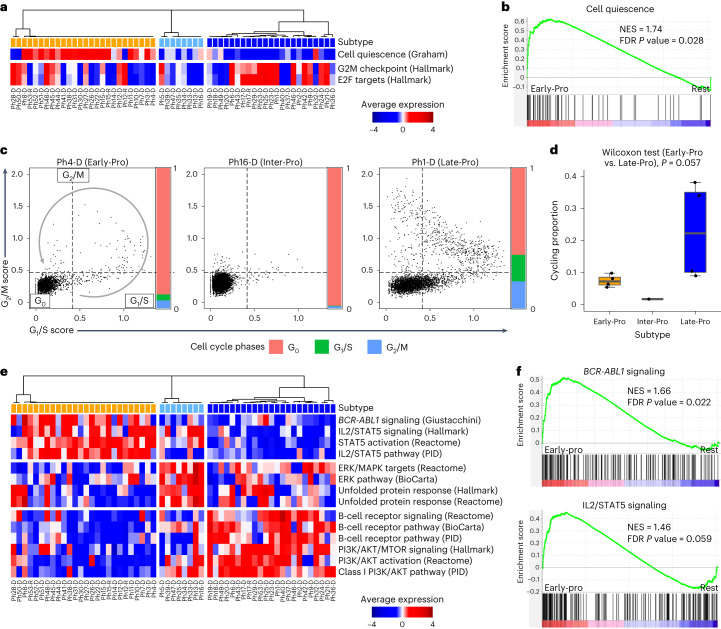
Fig. 6. Kinase domain-independent mechanisms of treatment resistance.
a, Heatmap of average gene expression for cell quiescence and cell cycling gene sets. Sample order and subtype colors are the same as in Fig. 1a. b, Enrichment of cell quiescence gene set in the Early-Pro subtype (versus rest). c, Average log2 expression (score) of G1/S and G2/M phase gene sets in single cells. Exemplar cases from three subtypes are shown. Dashed lines denote the G1/S and G2/M cutoffs (one standard deviation greater than mean). Bars represent proportions of cells in G0, G1/S and G2/M phases. d, Proportion of cycling cells (non-G0 phases) in each sample by subtype (four Early-Pro, one Inter-Pro and four Late-Pro leukemias). P value from the Wilcoxon rank-sum test comparing Early-Pro and Late-Pro samples is shown. e, Heatmap of average gene expression for various signaling gene sets. Sample order and subtype colors are the same as in Fig. 1a. f, Enrichment of BCR-ABL1 signaling and IL2/STAT5 signaling gene sets in the Early-Pro subtype (versus rest).

