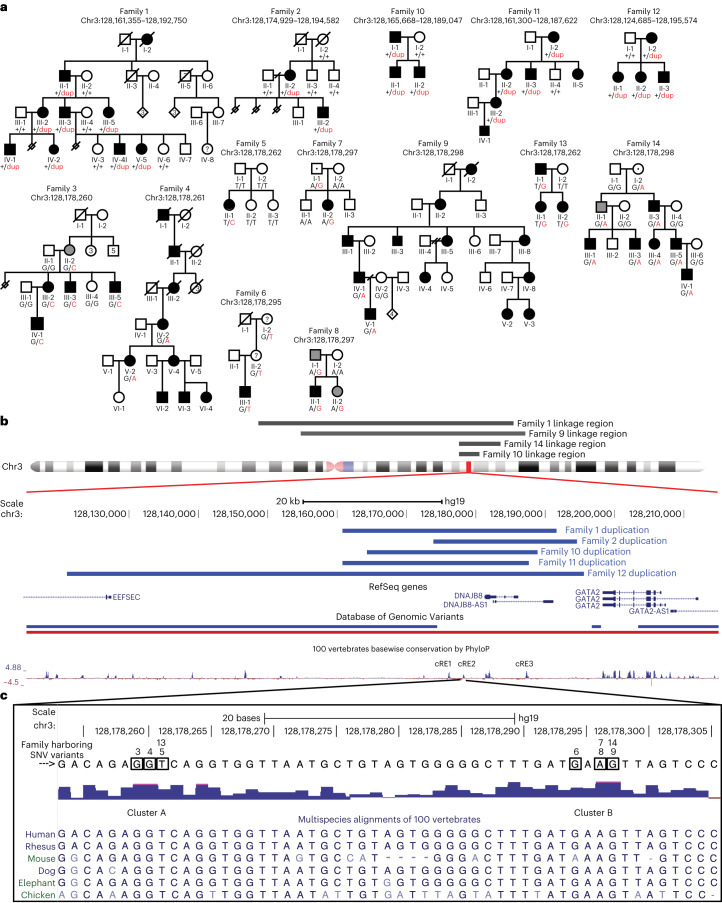
Fig. 1. Tandem duplications and noncoding heterozygous variants segregate with HCFP1.
a, Pedigrees of families 1–14. Above each pedigree is the chromosomal location of its CFP-causing variant. Below each individual is the pedigree position and, for participating individuals, the genotype for the variant allele (abbreviated pedigree is shown for Fam10, see ref. 15, and for Fam14, see ref. 14). For Fam1, -2 and -10 to -12, the WT allele is denoted by a black ‘+’ and the duplication allele by a red ‘dup’. For Fam3–9, -13 and -14, the WT and variant nucleotides are denoted by black and red letters, respectively. Squares show males, circles females; black fill shows affected and gray fill shows self-reported, unaffected but mild facial weakness on examination; and dotted square or circle shows nonpenetrant phenotype. b, Schematic genomic representation based on UCSC (University of California, Santa Cruz) Genome Browser output. Gray horizontal bars above chr3 ideogram denote previously reported HCFP1 linkage regions (chr3:127,454,048–130,530,963, all human coordinates are from GRCh37/hg19) (refs. 14,15) for Fam10 and Fam14, and regions consistent with linkage for Fam1 and Fam9 (63 Mb minimum overlap chr3:76,924,329–140,632,237). Under the ideogram are: GRCh37/hg19 nucleotide positions; thick blue horizontal bars denoting Fam1, -2 and -10 to -12 overlapping duplications; genes in the region; structural variants in the DGV (blue duplications, red deletions); and conservation based on the PhyloP score. Hg19 genomic coordinates are: GATA2 (chr3:128,198,270–128,212,044), cRE1 (chr3:128,176,017–128,176,396), cRE2 (chr3:128,178,158–128,178,397) and cRE3 (chr3:128,187,090–128,187,620). c, Magnification of the sequence and multispecies alignment of the cRE2-conserved region harboring all seven SNVs. The WT nucleotide of each SNV is boxed with the family ID harboring an SNV indicated above the box. The two clusters of variants lie 32 bp apart and are labeled ‘Cluster A’ and ‘Cluster B’. Multispecies alignment reveals, in mice, a 4-bp deletion between Cluster A and Cluster B, and lack of conservation of the Fam6 variant. See also Extended Data Figs. 1 and 2.

