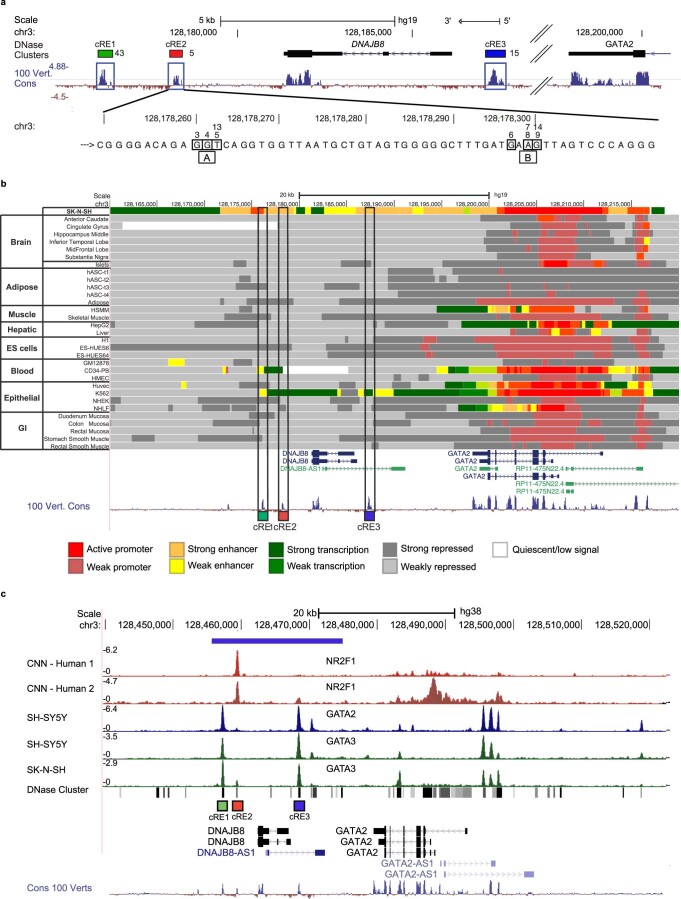
Extended Data Fig. 2. Detailed analysis of HCFP1 region.
(a) Magnification of the UCSC Genome Browser output from Fig. 1 with multispecies conservation and the three cREs boxed in blue. Green, red, and blue boxes above cREs denote DNAse clusters reported by ENCODE with the number of unique cell lines/tissue in which the cRE has been found open. (b) Chromatin state segmentation of the HCFP1 region in different human tissues and cell lines from CistromeDB30,31 and ENCODE1 data. In SK-N-SH neuroblastoma cells (top track), there are uninterrupted stretch enhancer regions 14.8kb in length encompassing cRE3 and 3.4kb in length encompassing cRE1 and cRE287. The active promoter and active transcription chromatin states indicate an overall high regulatory activity of this region in SK-N-SH cells. The largely repressive chromatin state of the corresponding region in a wide range of other tissues and cells (remaining tracks) highlights how cell-type-specific epigenomic states could potentially influence cRE activity and GATA2 expression. DNAJB8, a molecular chaperone not known to be associated with human disease, is not widely transcribed. (c) ChIP-seq results for NR2F1 and GATA3 from published datasets58. Blue horizontal bar above the ChIP-seq results indicates the minimal duplication region, and the green, red, and blue squares under the ChIP-seq results indicate the positions of cRE1, cRE2, and cRE3, respectively. NR2F1 shows specific binding to cRE2 in human iPSC-derived neural crest cells. By contrast, GATA2 and its effector transcription factor (TF) GATA3 bind specifically to cRE1 and cRE3, but not to cRE2 in neuroblastoma SK-N-SH and SH-SY5Y cells.

