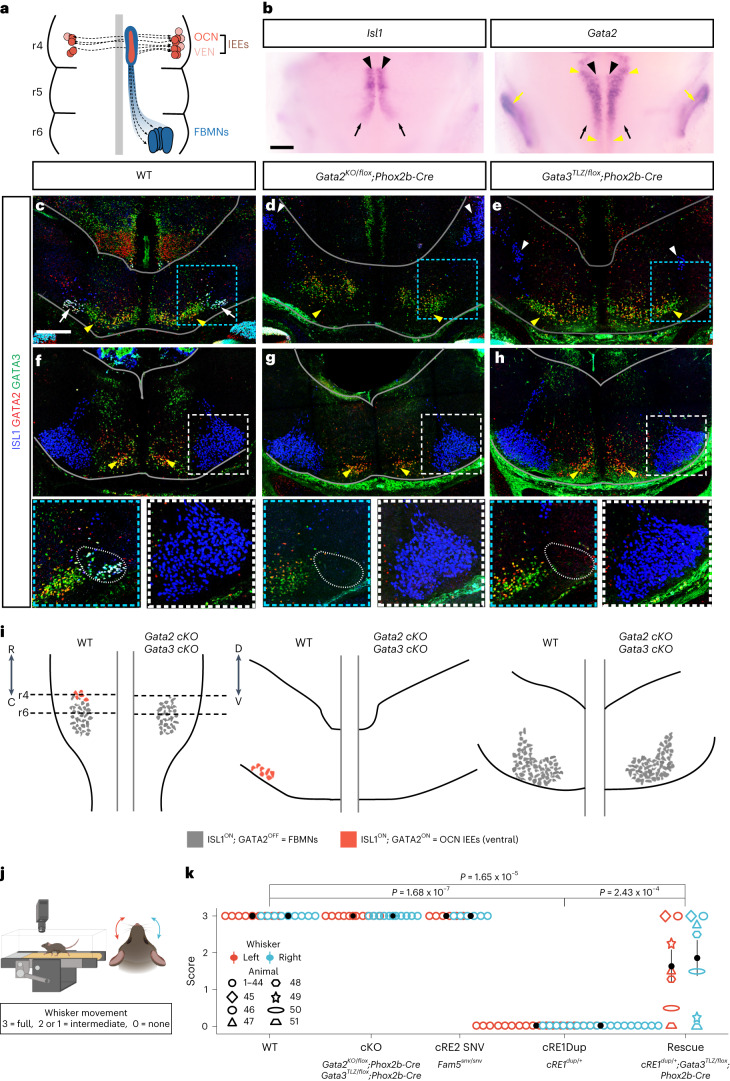
Fig. 3. Conditional loss of Gata2 or Gata3 prevents IEE development but does not impede FBMN development.
a, Migration schema of OCN (orange) and VEN (pink) IEEs and FBMNs (blue). b, E11.5 whole-mount Isl1 and Gata2 in situ hybridization: r4MN progenitor zone (black arrowheads), caudally migrating FBMNs (black arrows), parasagittal interneuron column (yellow arrowheads), developing inner ear (yellow arrows) (n = 3 WT, 10 cRE1dup/+ embryos). Scale bar, 200 μm. c–h, ISL1 (blue), GATA2 (red) and GATA3 (green) immunofluorescence on E14.5 WT (c,f), conditional Gata2KO/flox;Phox2b-Cre+ (d,g) and Gata3tlz/flox;Phox2b-Cre+ (e,h) KO hindbrains at r4 (c–e) and r6 (f–h). White arrows show OCN IEEs, yellow arrowheads show interneurons and the white arrowhead shows the trigeminal motor nucleus. Blue (r4) and white (r6) boxed regions are magnified below with a dotted oval denoting OCN IEE location (n = 3 (c,f), 6 (d,g) and 3 (e,h)). The borders of the hindbrain are outlined in gray. Scale bar, 200 μm (c) and applies to c–h. i, Schematics of E14.5 hindbrain cytoarchitecture based on c–h as viewed ventrally (left) and in cross-section at the level of r4 (middle) and r6 (right) in WT (left side of each schema) and Gata2 or Gata3 cKOs (right side of each schema). ISL1ON;GATA2ON IEEs (orange neurons) were absent from cKOs whereas ISL1ON;GATA2OFF FBMNs (gray) appeared normal. j, Whisking assay schematic. k, Whisker movement assessment. Both left and right whiskers scored 3 for all WT (n = 5 male (M), 4 female (F), Gata2KO/flox;Phox2b-Cre+ (n = 2 M, 3 F), Gata3tlz/flox;Phoxb2-Cre+ (n = 2 M, 4 F) and cRE2 Fam5snv/snv (n = 2 M, 4 F) mice). Both left and right whiskers scored 0 for all cRE1dup/+ mice (n = 8 M, 10 F). Of the cRE1dup/+;Gata3tlz/flox;Phox2b-Cre+ rescue mice (n = 1 M, 6 F), 2 had full (3) and 1 had no (0) whisker movement bilaterally, whereas the remaining 4 had intermediate movement (0 < x < 3). Pairwise, two-sided Bonferroni’s corrected Wilcoxon’s test (P values as shown). The filled circle shows mean and the error bar the s.e.m. Schemas in j were created with BioRender.com.

