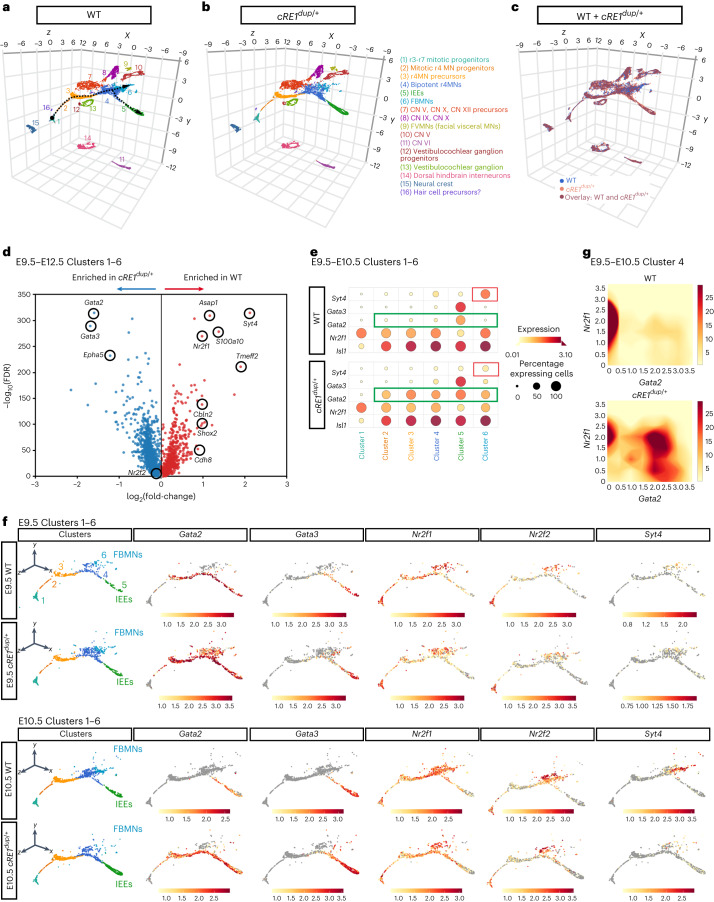
Fig. 6. Single-cell transcriptomic analysis of WT and cRE1dup/+ r4 motor neurons.
a,b, Three-dimensional (3D) UMAP plot of WT (a) and cRE1dup/+ (b) components of a E9.5–E12.5 scRNA-seq object comprising Isl1+ and/or Hoxb1+ FAC-sorted Isl1MN-GFP cranial motor neurons (MNs) (with GFP− cells spiked in) spanning r3–r7. Seurat clusters are numbered and annotated according to proposed cellular identity at the right. CN, cranial nucleus. The black dotted arrows trace the proposed pseudotime developmental trajectory of r4MNs from mitotic progenitors of r3–r7 neurons (Cluster 1), r4MN mitotic progenitors (Cluster 2) and r4MN precursors (Cluster 3), ‘bipotent r4MNs’ (Cluster 4), which gave rise to separate populations of IEEs (Cluster 5) defined by Gata2 and Gata3 expression18,19, and FBMNs (Cluster 6) defined by Syt4, Shox2 and Cdh8 expression and enriched for Nr2f1 (refs. 18,19,74,75) (Extended Data Fig. 6c,d). c, Overlapping feature plots of WT (blue, bottom layer) and cRE1dup/+ (peach, top layer) 3D UMAPs shown in a and b. Sixty percent opacity of cRE1dup/+ data points reveals WT data and highlights overlap of the genotypes (burgundy). d, Volcano plot of differential expression analysis between WT and cRE1dup/+ r4MN trajectories across the E9.5–E12.5 timepoints. Circled genes display log(fold-change) > 1 and −log10(FDR) > 200 or are additional genes of interest (where FDR is false recovery rate). e, Dotplot comparison of FBMN and IEE marker expression in E9.5–E10.5 Cluster 1–6 r4MN developmental trajectories in WT (upper) and cRE1dup/+ (lower) embryos. Red and green outlines highlight differences in Syt4 and Gata2 expression, respectively, between WT and cRE1dup/+ samples. Scales indicate the mean expression level and percentage expressing cells within each cluster. f, Feature plots of WT and cRE1dup/+ r4MN trajectory determinants and markers at E9.5 (upper two rows) and E10.5 (lower two rows). At E9.5 in both WT and cRE1dup/+ embryos, r4MN precursors, a subset of IEE-directed bipotent r4MNs and IEEs (Clusters 3–5), expressed Gata2, with additional ectopic expression seen in cRE1dup/+ FBMNs (Cluster 6). By E10.5, WT embryos expressed Gata2 only in Cluster 5 IEEs, but cRE1dup/+ embryos maintained Gata2 expression in Clusters 3–5. g, Density plots for Nr2f1 and Gata2 expression in E9.5–E10.5 WT and cRE1dup/+ r4MNs. See also Extended Data Fig. 6.

