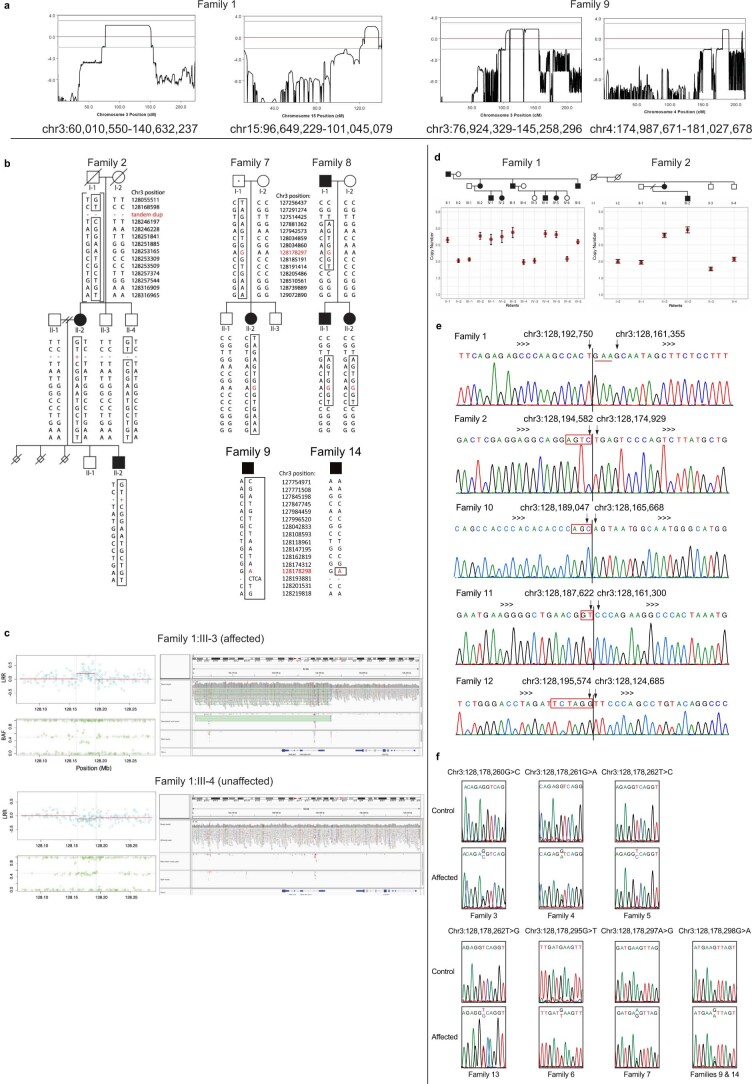
Extended Data Fig. 1. Genetic analysis of HCFP1 pedigrees.
(a) The HCFP1 locus linkage data in Fam1 (LOD 2.1) and Fam9 (LOD 1.8). (b) Fam2, Fam7-9, Fam14 haplotypes. hg19 position of each SNP on chromosome 3 provided; disease-causing variants are indicated in red. Fam2 duplication arose de novo in II-2 on an allele inherited from I-1 (Fam2:I-1 haplotypes assumed). Fam7 and Fam8 harbored the same HCFP1 SNV and shared a >310 kb haploidentical region (chr3:127,881,362-chr3:128,191,414), suggesting the SNV is derived from a common ancestor. Fam9 and Fam14 harbor the same SNV on different haplotypes, suggesting independent mutational events. (c) SNP array data (left) and genome sequence (right) encompassing the Fam1 duplication; affected Fam1:III-3 (top), unaffected Fam1:III-4 (bottom). For SNP arrays, the Log R Ratio (LRR) is displayed in blue (top) and the B Allele Frequency (BAF) in green (bottom). Boundaries of the duplication are indicated by vertical dashed lines. LRR value reflects total copy number with the mean value, indicated by red horizontal lines, higher in duplicated than in flanking regions. BAF value is the proportion of B allele among A and B alleles at each SNP; 0, 0.5, and 1 correspond to AA, AB, and BB genotypes. The deviation from 0.5 to 0.33 or 0.66 within Fam1:III-3 corresponds to unbalanced genotypes AAB or ABB, reflecting a duplication signal. (Right) Aligned reads near the breakpoints of each of the two duplications visualized with Integrative Genomics Viewer. Location of the chromosomal region along with read depth, all read pairs, discordant read pairs, and split reads is shown. Duplicated region is highlighted in green. (d) Copy number quantification using digital droplet PCR for Fam1 and Fam2 duplications. Copy number values are the average of three experiments. Error bars indicate standard error. (e) Sanger sequencing traces that define duplication breakpoints (vertical black line) for each pedigree. Arrows preceding and following the vertical line indicate the most distal and proximal nucleotide in the duplication, respectively. Fam1 has an insertion of nucleotides GAA at the breakpoint (underlined). Fam2, Fam10-Fam12 have microhomology identified at the breakpoint (red-boxed nucleotides). (f) Sanger sequencing traces for each SNV with representative results of an affected and control individual.

