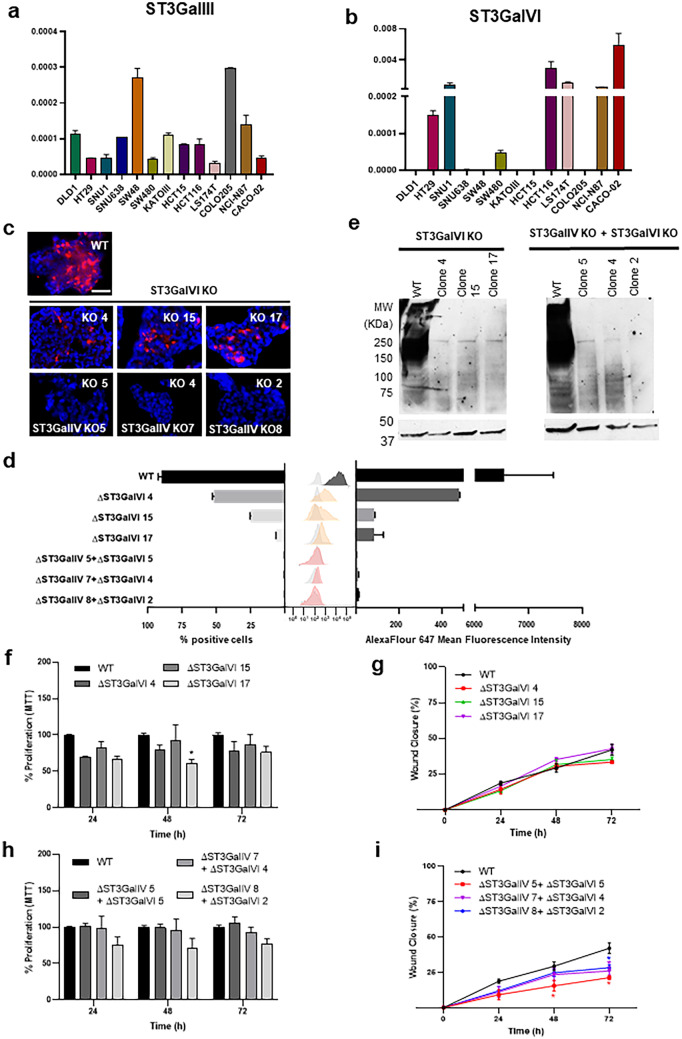
Fig. 5.
Role of ST3GalVI in SLeX expression and malignant properties of LS174T cells. (a) Expression analysis of St3GalIII in a panel of GI cancer cell lines showing a heterogeneous expression within cell lines, with LS174T presenting the lowest expression. (b) Expression analysis of St3GalVI in a panel of GI cancer cell lines showing a heterogeneous expression within cell lines, with LS174T presenting a significant expression. Bar graph shows the mean relative quantification values for each gene, normalized to the internal control gene ACTB. (c) immunofluorescence analysis of LS174T ST3GalVI KO cells showing a reduced SLeX expression in ST3GalVI KO clones and a complete abolishment of expression in ST3GalIV/VI KO clones. The scale bar corresponds to 50 μm. (d) Expression levels and percentage of SLeX positive cells measured by flow cytometry analysis, showing a complete abolishment of SLeX detection in the double KO cells. (e) Western blot analysis of ST3GalVI KO clones showing the capacity of ST3GaVI and ST3GalIV/VI KO in impair SLeX expression at the protein level. (f), (h) Proliferation analysis in ST3GalVI KO clones showing no statistically significant differences. (g), (i) Motility capacity of ST3GalVI KO clones showing a reduced cell motility only in ST3GalIV/VI KO clones

