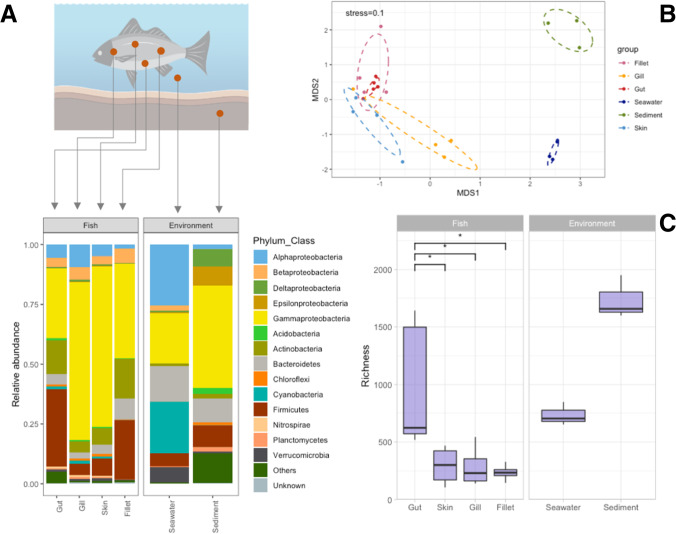
Fig. 1.
Panel A: barplot showing the prokaryotic community composition (as relative abundance) at the phylum and class level (for Proteobacteria only). Taxa with an average relative abundance across all samples < 1% were aggregated as “Others”. “Unknown” includes all those reads that did not match any known taxa. Panel B: nonmetric multidimensional scaling (NMDS) ordination of community composition of fish and environmental microbiomes based on Bray–Curtis dissimilarity matrix. Panel C: richness calculated for the different types of samples; asterisks indicate the occurrence of significant differences as calculated by the Kruskal–Wallis test (p < 0.05); non-significant comparisons are not reported in the plot. Richness in environmental samples also significantly differed from those observed in fish-associated microbiomes (Kruskal–Wallis p < 0.05). The fish figure has been created in BioRender (https://biorender.com/)

