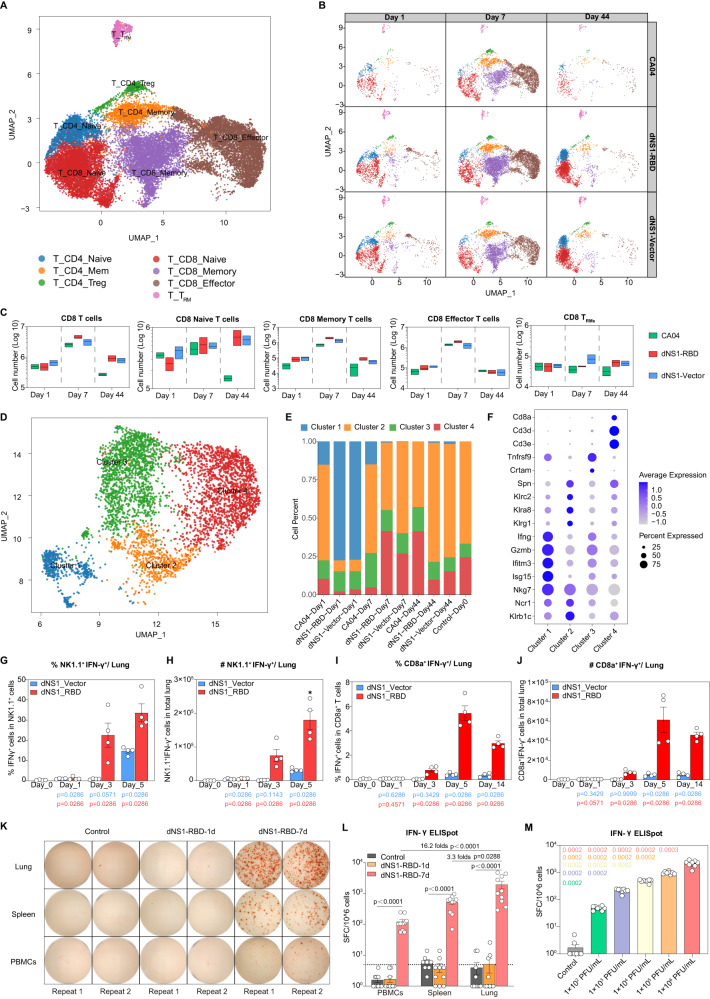
Fig. 2. Intranasal immunization of dNS1-RBD and dNS1-Vector activate T and NK cells.
A UMAP plot showing iterative clustering results of T cells reveals subpopulations corresponding to different states of differentiation. B UMAP plots showing T cells dynamics with dNS1-RBD-immunized, dNS1-Vector-immunized, and CA04-infected mice in different time points. C Box plots showing the cell numbers of all different CD8 T cells across all groups. CA04 (green), dNS1-Vector (blue) and dNS1-RBD (red). n = 2–3 biologically independent mice/group. Box plots show the mean (center line) and minimum and maximum values (bounds of box). D UMAP plot showing iterative clustering results of NK cells reveals subpopulations corresponding to different states of differentiation. E Stacked barplot showing the proportion of different NK cells. F Dot plots of cells expressing selected canonical marker genes for identification of different cell types in NK cells. G, H Statistical analysis plots for percentage (G) and cell number (H) of NK1.1+ IFN-γ+ in the lung. n = 4 biologically independent mice/group, dNS1-Vector (blue) and dNS1-RBD (red). I, J Statistical analysis plots for percentage (I) and cell number (J) of CD8a+ IFN-γ+ in the lung. n = 4 biologically independent mice/group, dNS1-Vector (blue) and dNS1-RBD (red). K Representative well images of the IFN-γ ELISpot response of the control group and dNS1-RBD group (1- and 7-days post-immunization). L SFCs per million cells of IFN-γ from PBMCs, spleen, and lung were quantified after stimulation of a peptide pool covering the entire spike protein. n = 10 biologically independent mice/group, control (gray), dNS1-RBD-1d (orange) and dNS1-RBD-7d (red). M SFCs per million cells of IFN-γfrom lung were quantified after stimulation of a peptide pool covering the entire spike protein in control and vaccinated group (1 × 10⁶ PFU/mL, 1 × 10⁵ PFU/mL, 1 × 10⁴ PFU/mL, 1 × 10³ PFU/mL, 1 × 10² PFU/mL). n = 8 mice biologically independent mice/group. P-values are shown in the figure using different colors compared with the 1 × 10⁶ PFU/mL group is represented in pink (1 × 10⁵ PFU/mL in orange, 1 × 10⁴ PFU/mL group in yellow, 1 × 10³ PFU/mL in purple, and 1 × 10² PFU/mL in green). Data are presented as mean ± SEM. Box plots show the mean (center line) and minimum and maximum values (bounds of box). Statistics analyses were Mann–Whitney tests (two-sided). Source data are provided as a Source Data file. P-values are shown in the figure using different colors in (G–J), the dNS1-Vector group compared with the control is represented in blue (dNS1-RBD in red). UMAP: Uniform Manifold Approximation and Projection; NK cells: natural killer cells; IFN-γ: interferon-gamma; SFCs: spot-forming cells; PBMCs: peripheral blood mononuclear cells; TRMs: tissue-resident memory T cells.

