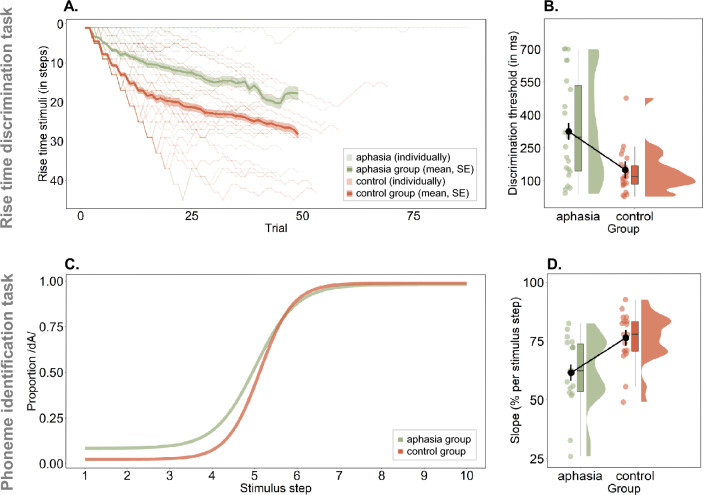
Figure 2.
IWA show decreased performance at two auditory-phonemic processing tasks. (A) The RTD thresholds were determined via a one-up/two-down adaptive staircase procedure. This figure shows the individual performance trajectories as well as the group average and standard error across trials for visualization purpose. The deviant stimulus rise times of the last 4 reversals were averaged to determine the final threshold, which was used for statistical analysis. (B) IWA at group level processed the rate of change in amplitude less precisely (i.e., larger differences in rise time are needed to discriminate stimuli) than healthy, age-matched controls, even when controlling for hearing and cognition. (C) Visualization of the average of subject-specific psychometric functions by group, representing performance on the phoneme identification task. The steeper the slope, the more consistently a phoneme is identified, hence suggesting better phoneme representation. (D) IWA showed significantly lower slopes than age-matched controls at group level on the phoneme identification task, even when controlling for hearing and cognition.

