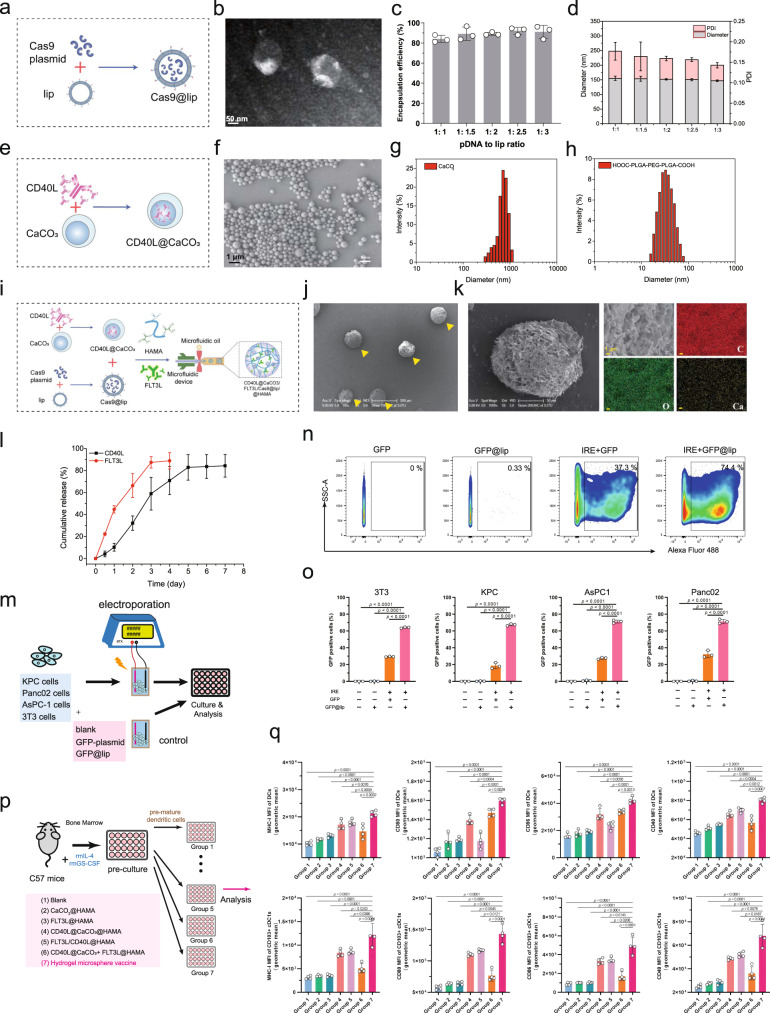
Fig. 2. Preparation and functional validation of the hydrogel microsphere vaccine in vitro.
a Schematic diagram of the preparation of Cas9@liposome nanoparticles. b Representative TEM images of the plasmid@lip nanoparticles. c, d Encapsulation efficiency (c), particle size distribution and PDI value (d) of the Cas9@lip nanoparticles. n = 3 independent experiments. Data are presented as mean values +/− SD. e Schematic diagram of the preparation of the CD40L@CaCO3 nanoparticles. f Representative scanning electron microscope (SEM) images of the CD40L@CaCO3 nanoparticles. g Identification of the hydrodynamic diameter of the CD40L@CaCO3 nanoparticles using the Malvern–Zetasizer method. h Identification of the hydrodynamic diameter of the HOOC–PLGA–PEG–PLGA–COOH solution. i Schematic diagram of the preparation of the hydrogel microsphere vaccine. j Representative scanning electron microscope (SEM) images of the hydrogel microspheres. k Enlarged representative SEM image (left panel) and regional element analysis (right panel) of the hydrogel microsphere vaccine. l The release of FLT3L and CD40L by the hydrogel microsphere vaccine in vitro (pH = 6.8). n = 3 independent experiments. Data are presented as mean values +/− SD. m Schematic diagram of cell transfection analysis using the combination of the hydrogel microsphere vaccine and electroporation. n Representative images of flow cytometry experiments identifying GFP-positive KPC cells in different treatment groups (o). o Analysis of the transfection efficiency of 3T3\KPC\AsPC1\Panc02 cells in different treatment groups. n = 3 biologically independent samples. p Schematic diagram illustrating the effect of hydrogel microsphere vaccines and different hydrogel counterparts on bone marrow-derived dendritic cells (BMDCs) in vitro. q Analysis of the effect of hydrogel microsphere vaccines and hydrogel microsphere counterparts on the expression of MHC-I, CD40, CD80 and CD86 on the surface of total DCs (CD24+CD64−CD11c+MHCII+CD45+alive) and cDC1s (CD103+CD11b-CD24+CD64−CD11c+MHCII+CD45+alive) in different treatment groups. n = 4 biologically independent samples. b, f, j, k Three independent experiments were performed to confirm data stability. o, q Data are presented as mean values +/− SEM. Two-tailed unpaired t test. Source data are provided as a Source data file.

