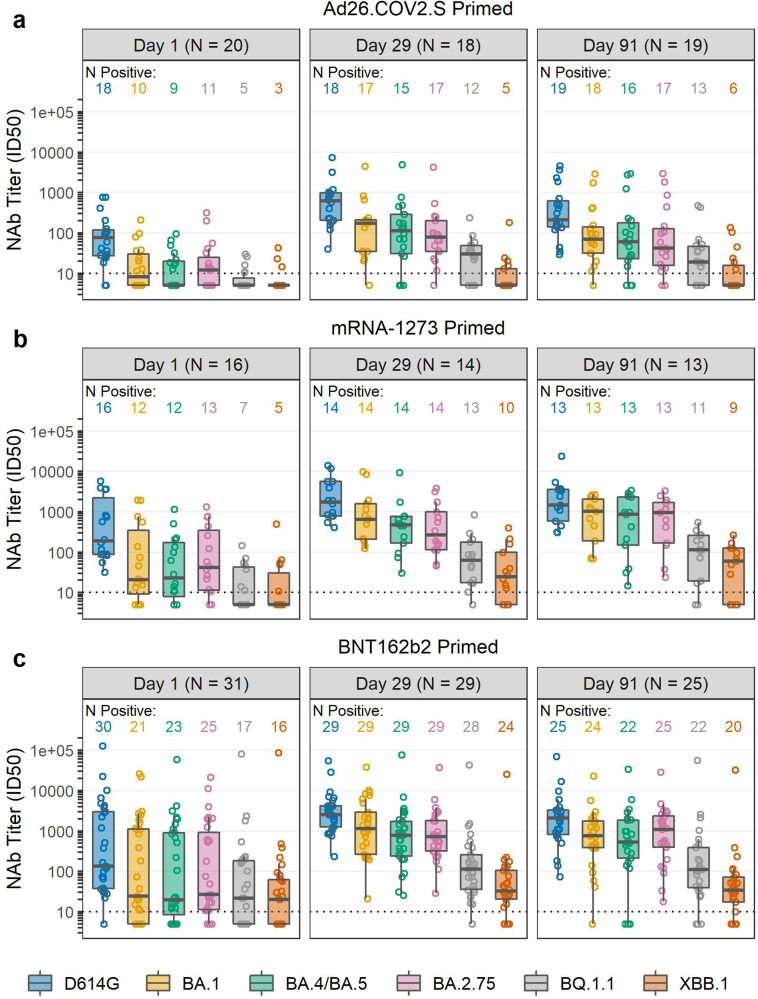
Fig. 2. Pseudovirus neutralization antibodies expressed as 50% inhibitory dilution (ID50) to the D614G variant and Omicron sub-lineages at Day 1 (pre-booster) and Days 29 and 91 post-NVX-CoV2373 booster.
The boxplot panels represent (a) Ad26.COV2.S-primed, (b) mRNA-1273-primed; and (c) BNT162b2-primed participants boosted with NVX-CoV2373. The number of participants with serum samples collected and assayed at each visit are shown at the top of each panel. The number of positive samples against each of the variant strains are shown above each box plot. Box plots represent median (horizontal line within the box) and 25th and 75th percentiles (lower and upper borders of the box), with the whiskers drawn to the value nearest to, but within, 1.5× interquartile range above and below the borders of the box and individual results depicted in open circles. The lower level of detection is 10 and technical duplicates were performed.

